International Geomagnetic Reference Field (IGRF)
In October 2024 BGS contributed to the creation of the 14th generation of the International Geomagnetic Reference Field (IGRF). The IGRF is a collaborative model produced by geomagnetists from around the world and endorsed by the International Association of Geomagnetism and Aeronomy (IAGA). The IGRF is a common tool for survey geophysicists and space scientists who use it as a global reference model. The IGRF dates back to around 1970 and grew out of discussions that took place within IAGA in the 1960s following the World Magnetic Survey and International Geophysical Year of 1957-1958.
The IGRF is updated every five years, and currently describes the the field from 1900 to 2030. Currently the IGRF is a spherical harmonic degree 13 model, with maximum harmonic degree 8 for the SV component. Prior to 1995 the IGRF only extends to harmonic degree 10, because of the lower spatial density of measurements, mainly ground observatories, that was typical of the pre-Ørsted, CHAMP, and (ongoing) Swarm satellite era. The models up to and including 2020 are now designated as ‘definitive’ models (i.e. known as DGRFs), in that the potential for further improving these is regarded by IAGA as slight.
The BGS candidate models for IGRF-14 were evaluated alongside those from eighteen other contributing teams, made up of institutes around the world. In November 2024, the three BGS candidates for the 2020 definitive field, 2025 predicted field and 2025-2030 rate-of-change (secular variation, SV) models were accepted and incorporated into IGRF-14. The official IAGA V-MOD GitHub repository holds details of all the submitted candidates, the analysis and final coefficient files.
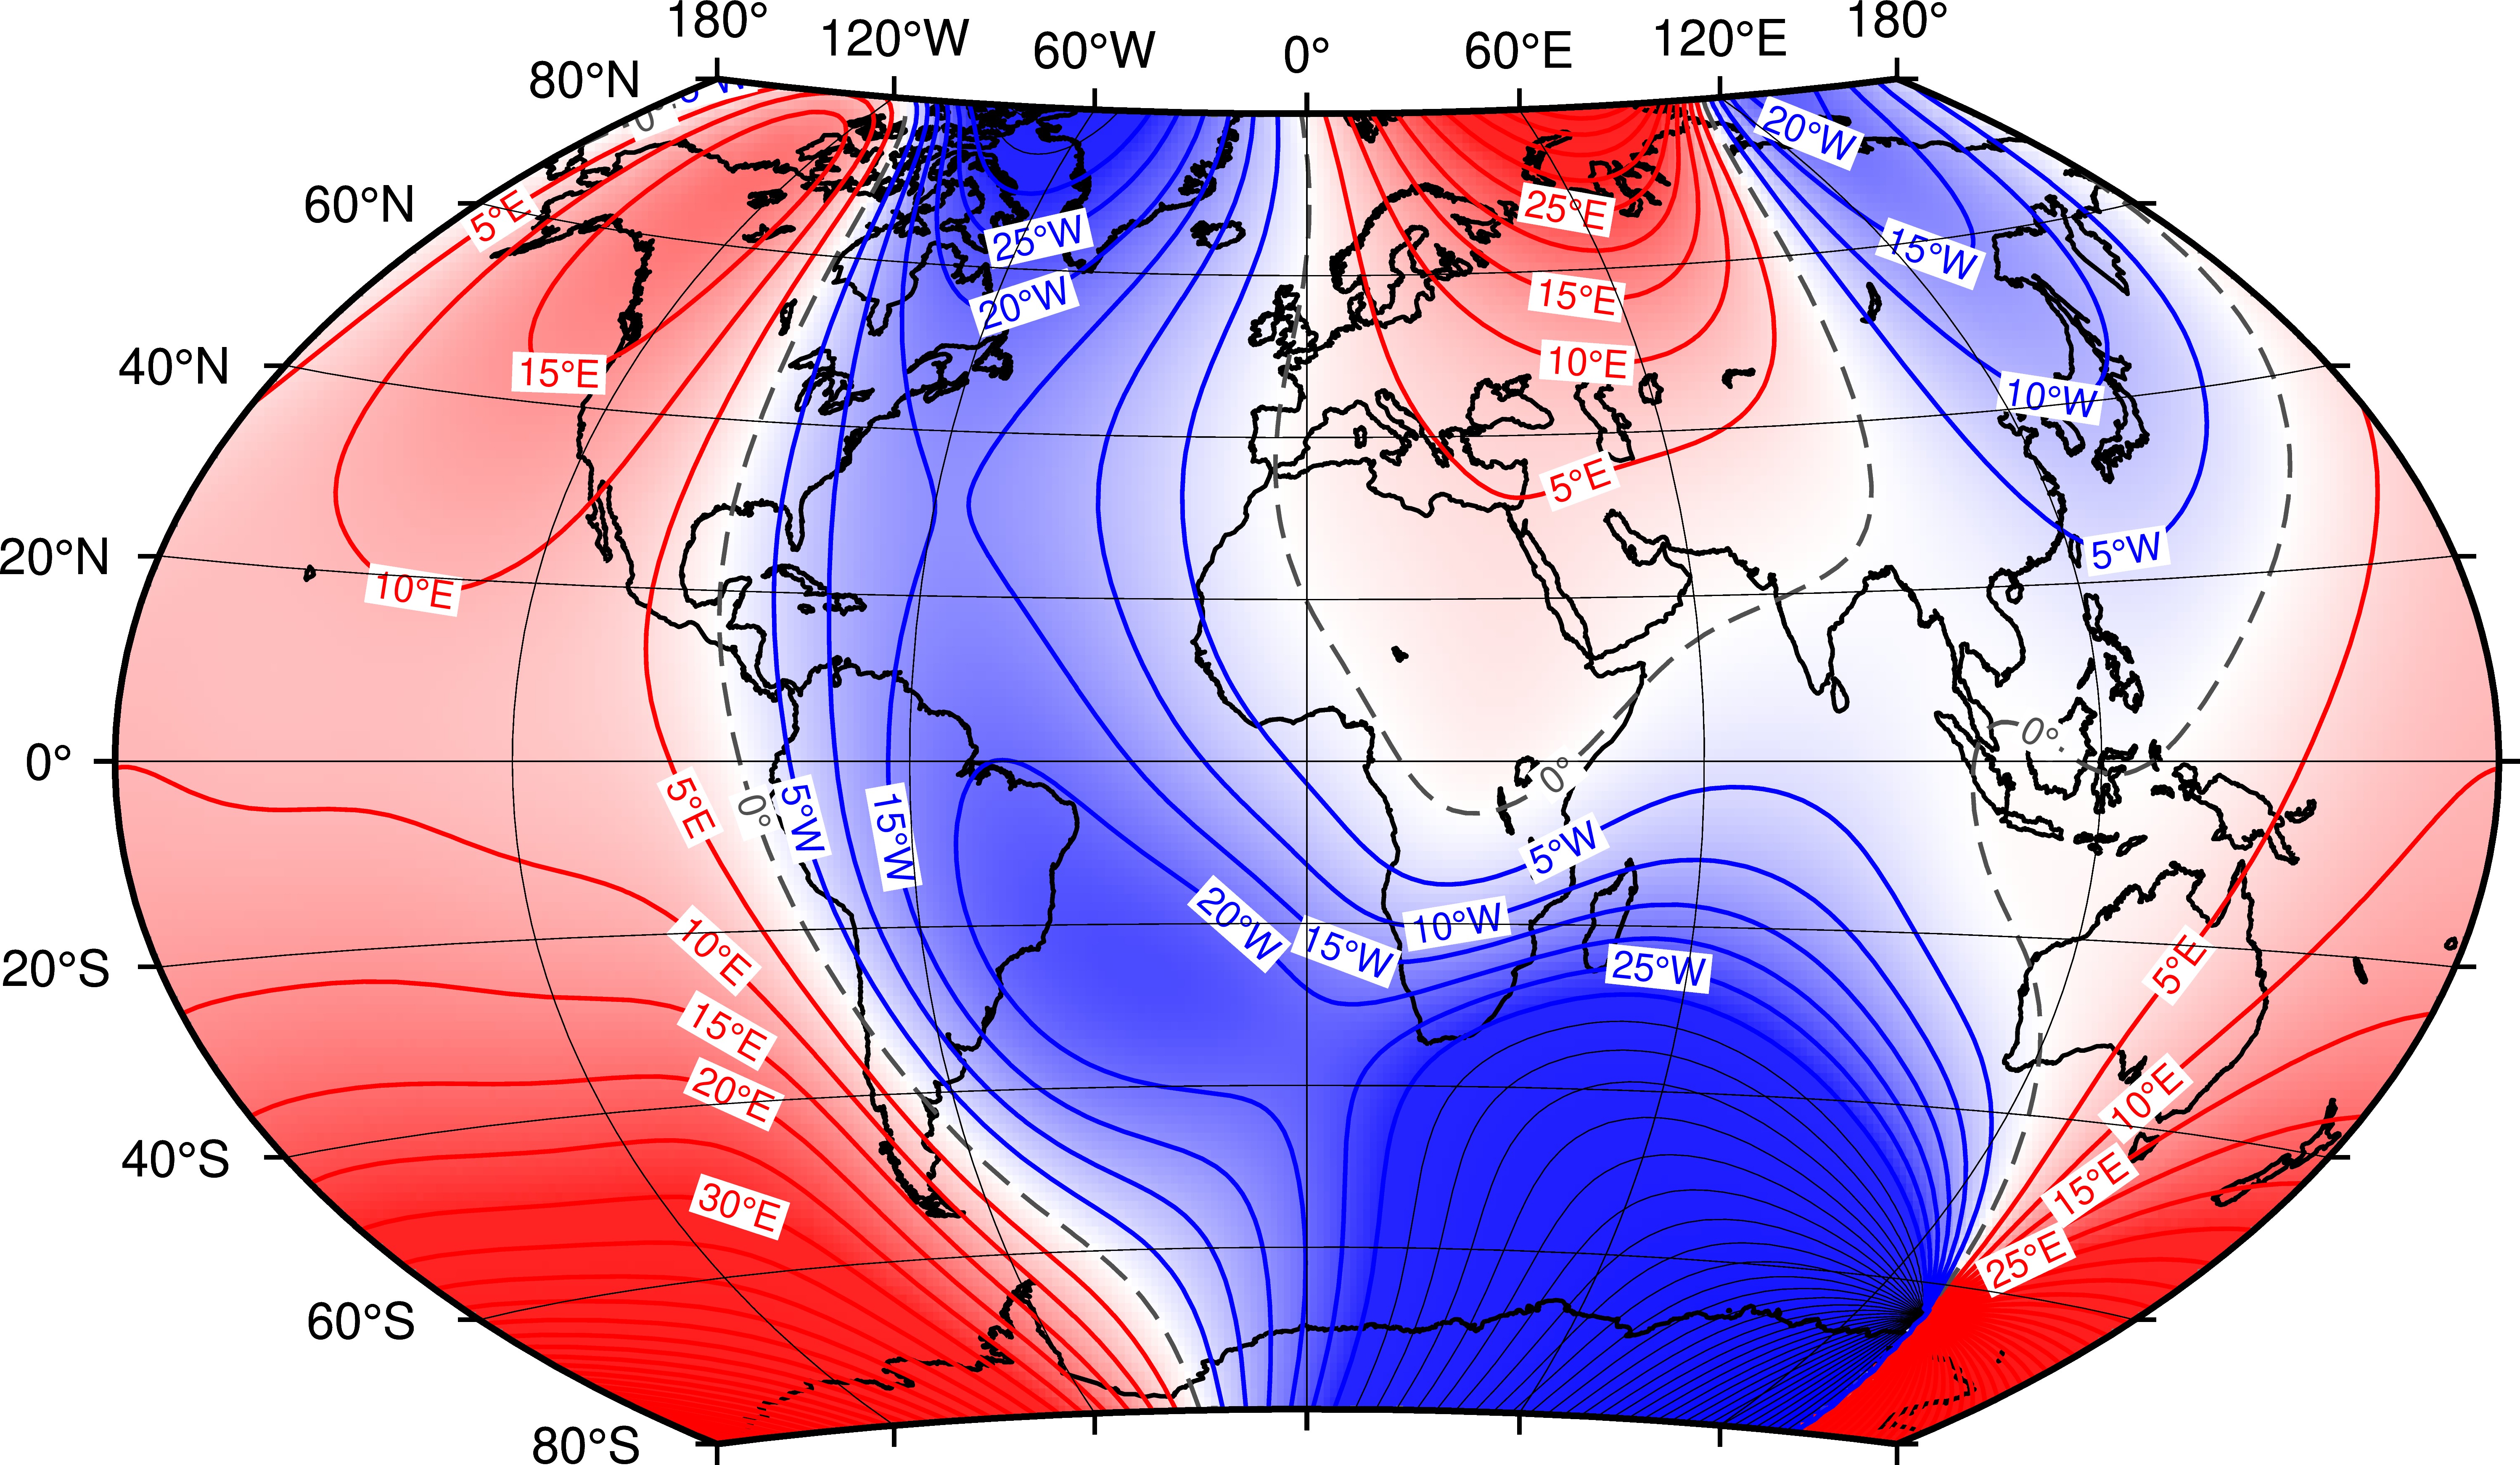
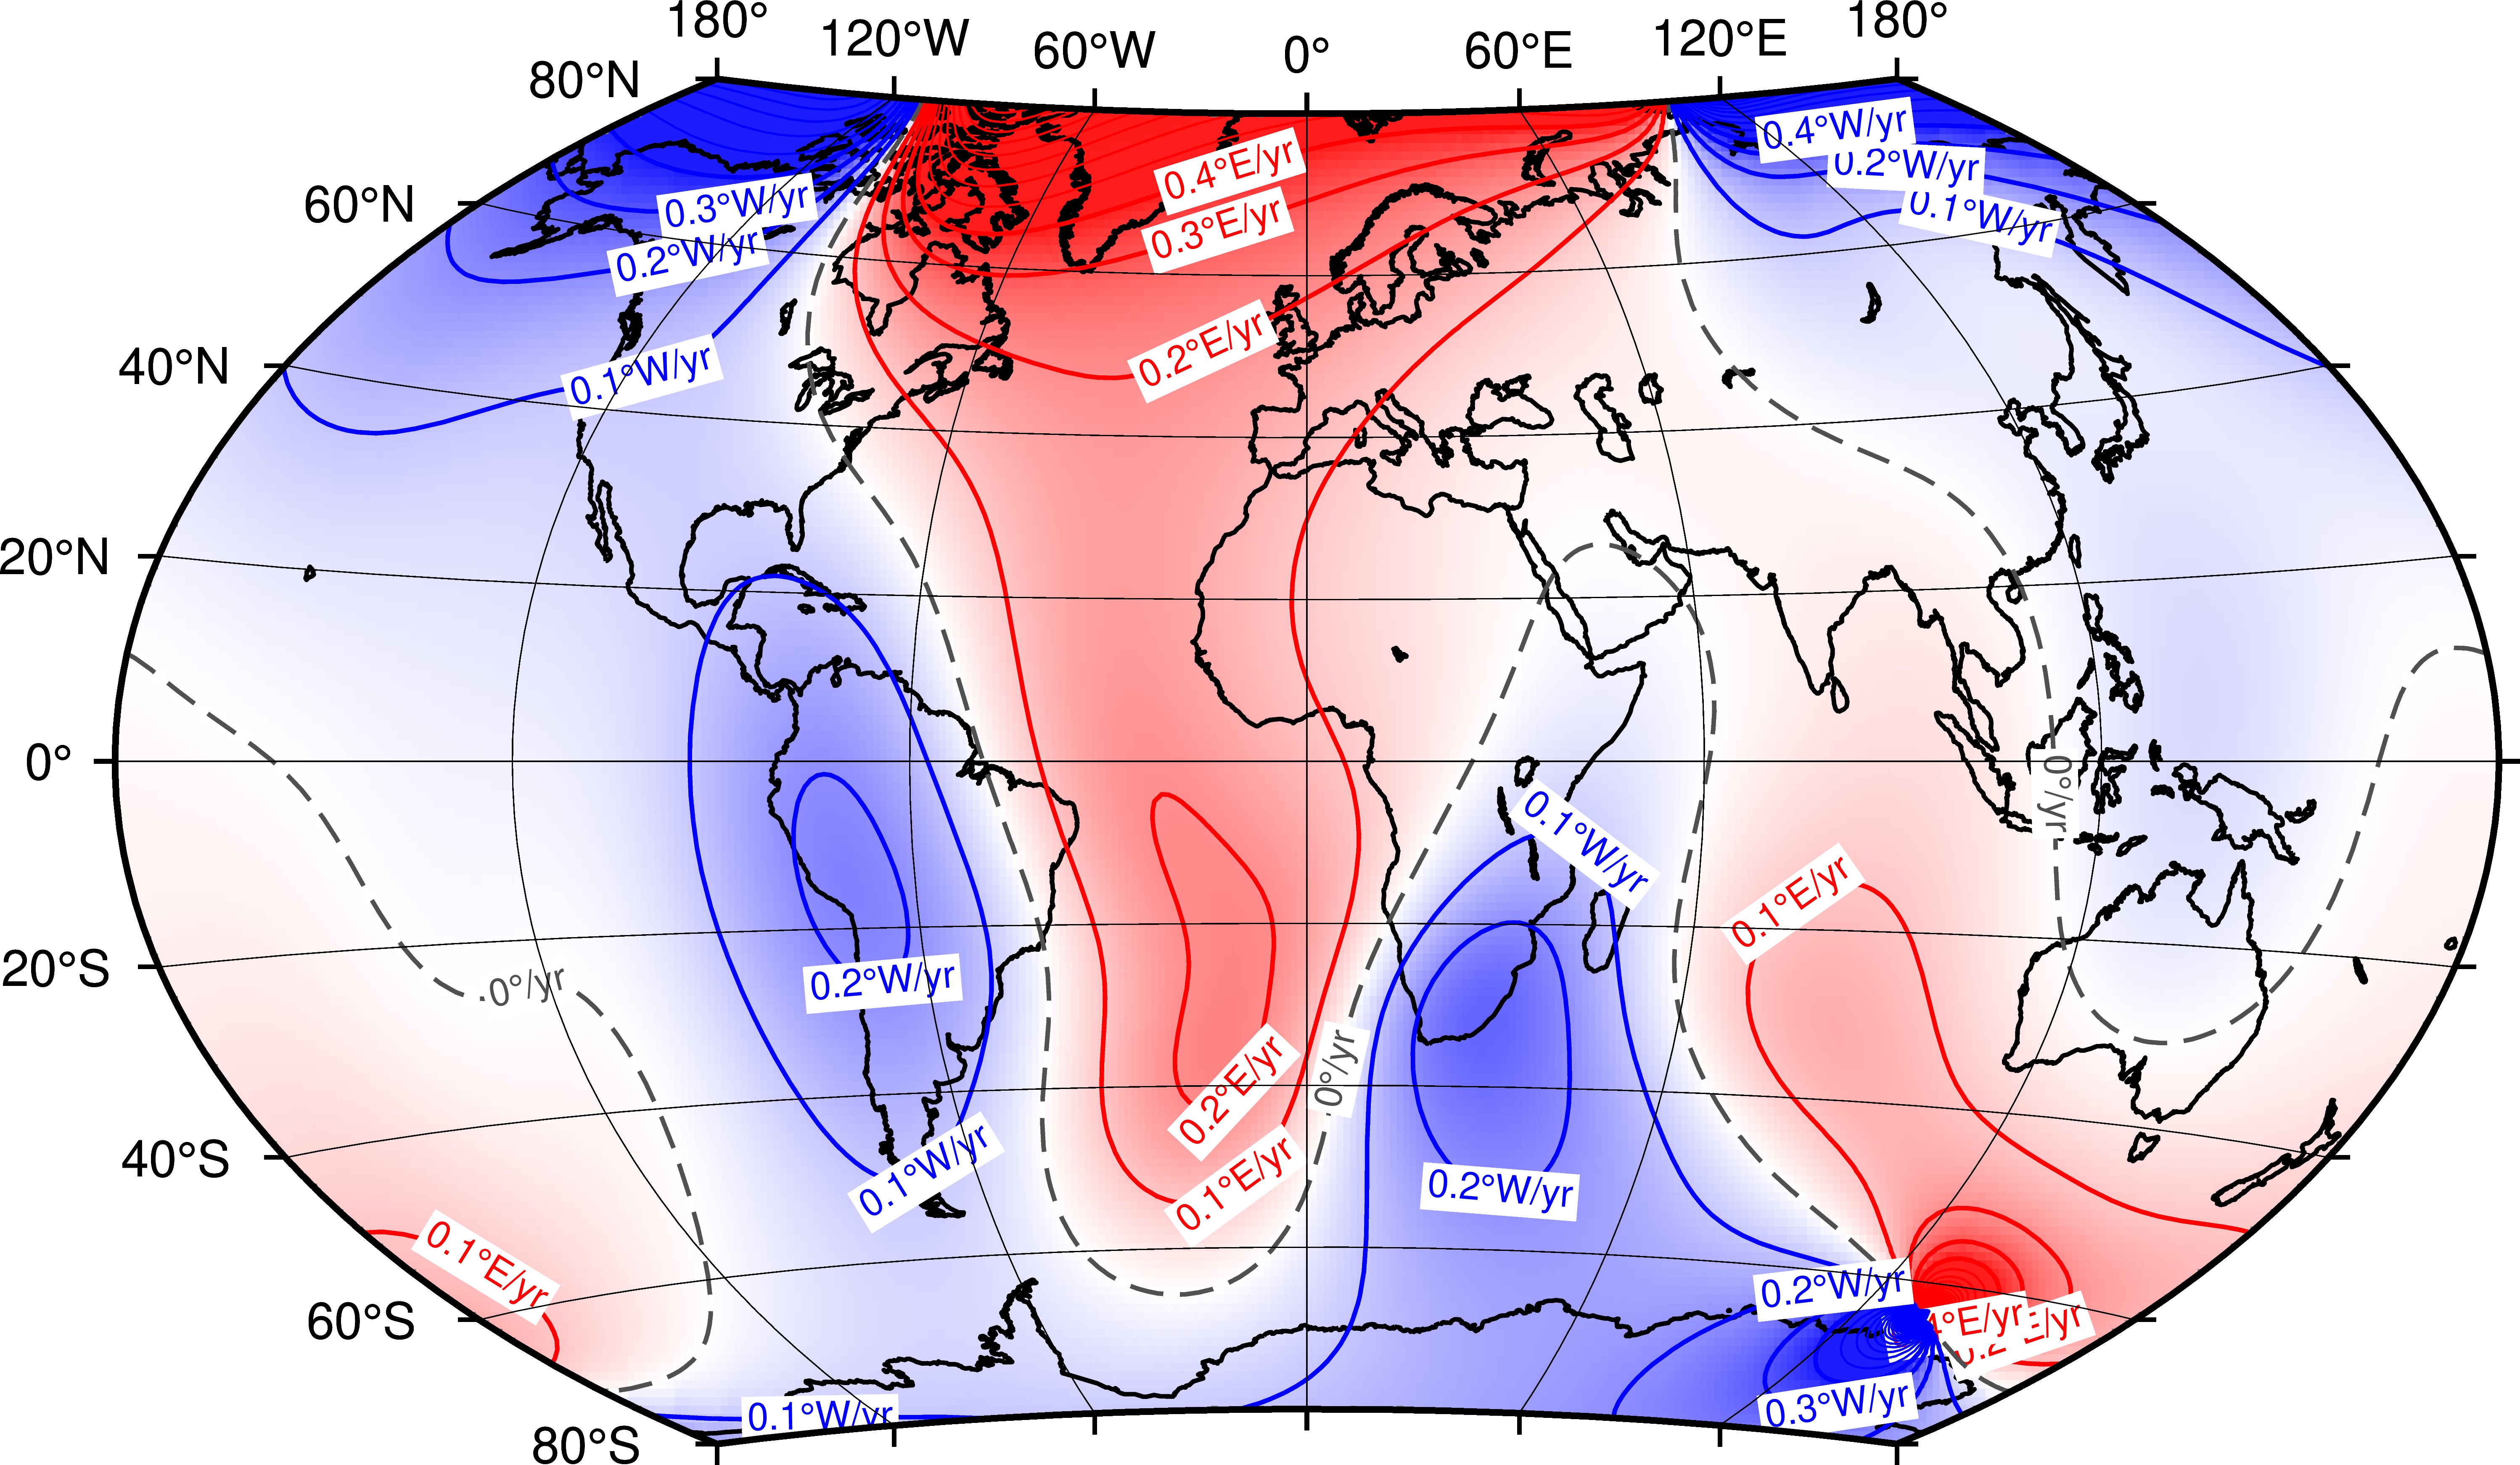
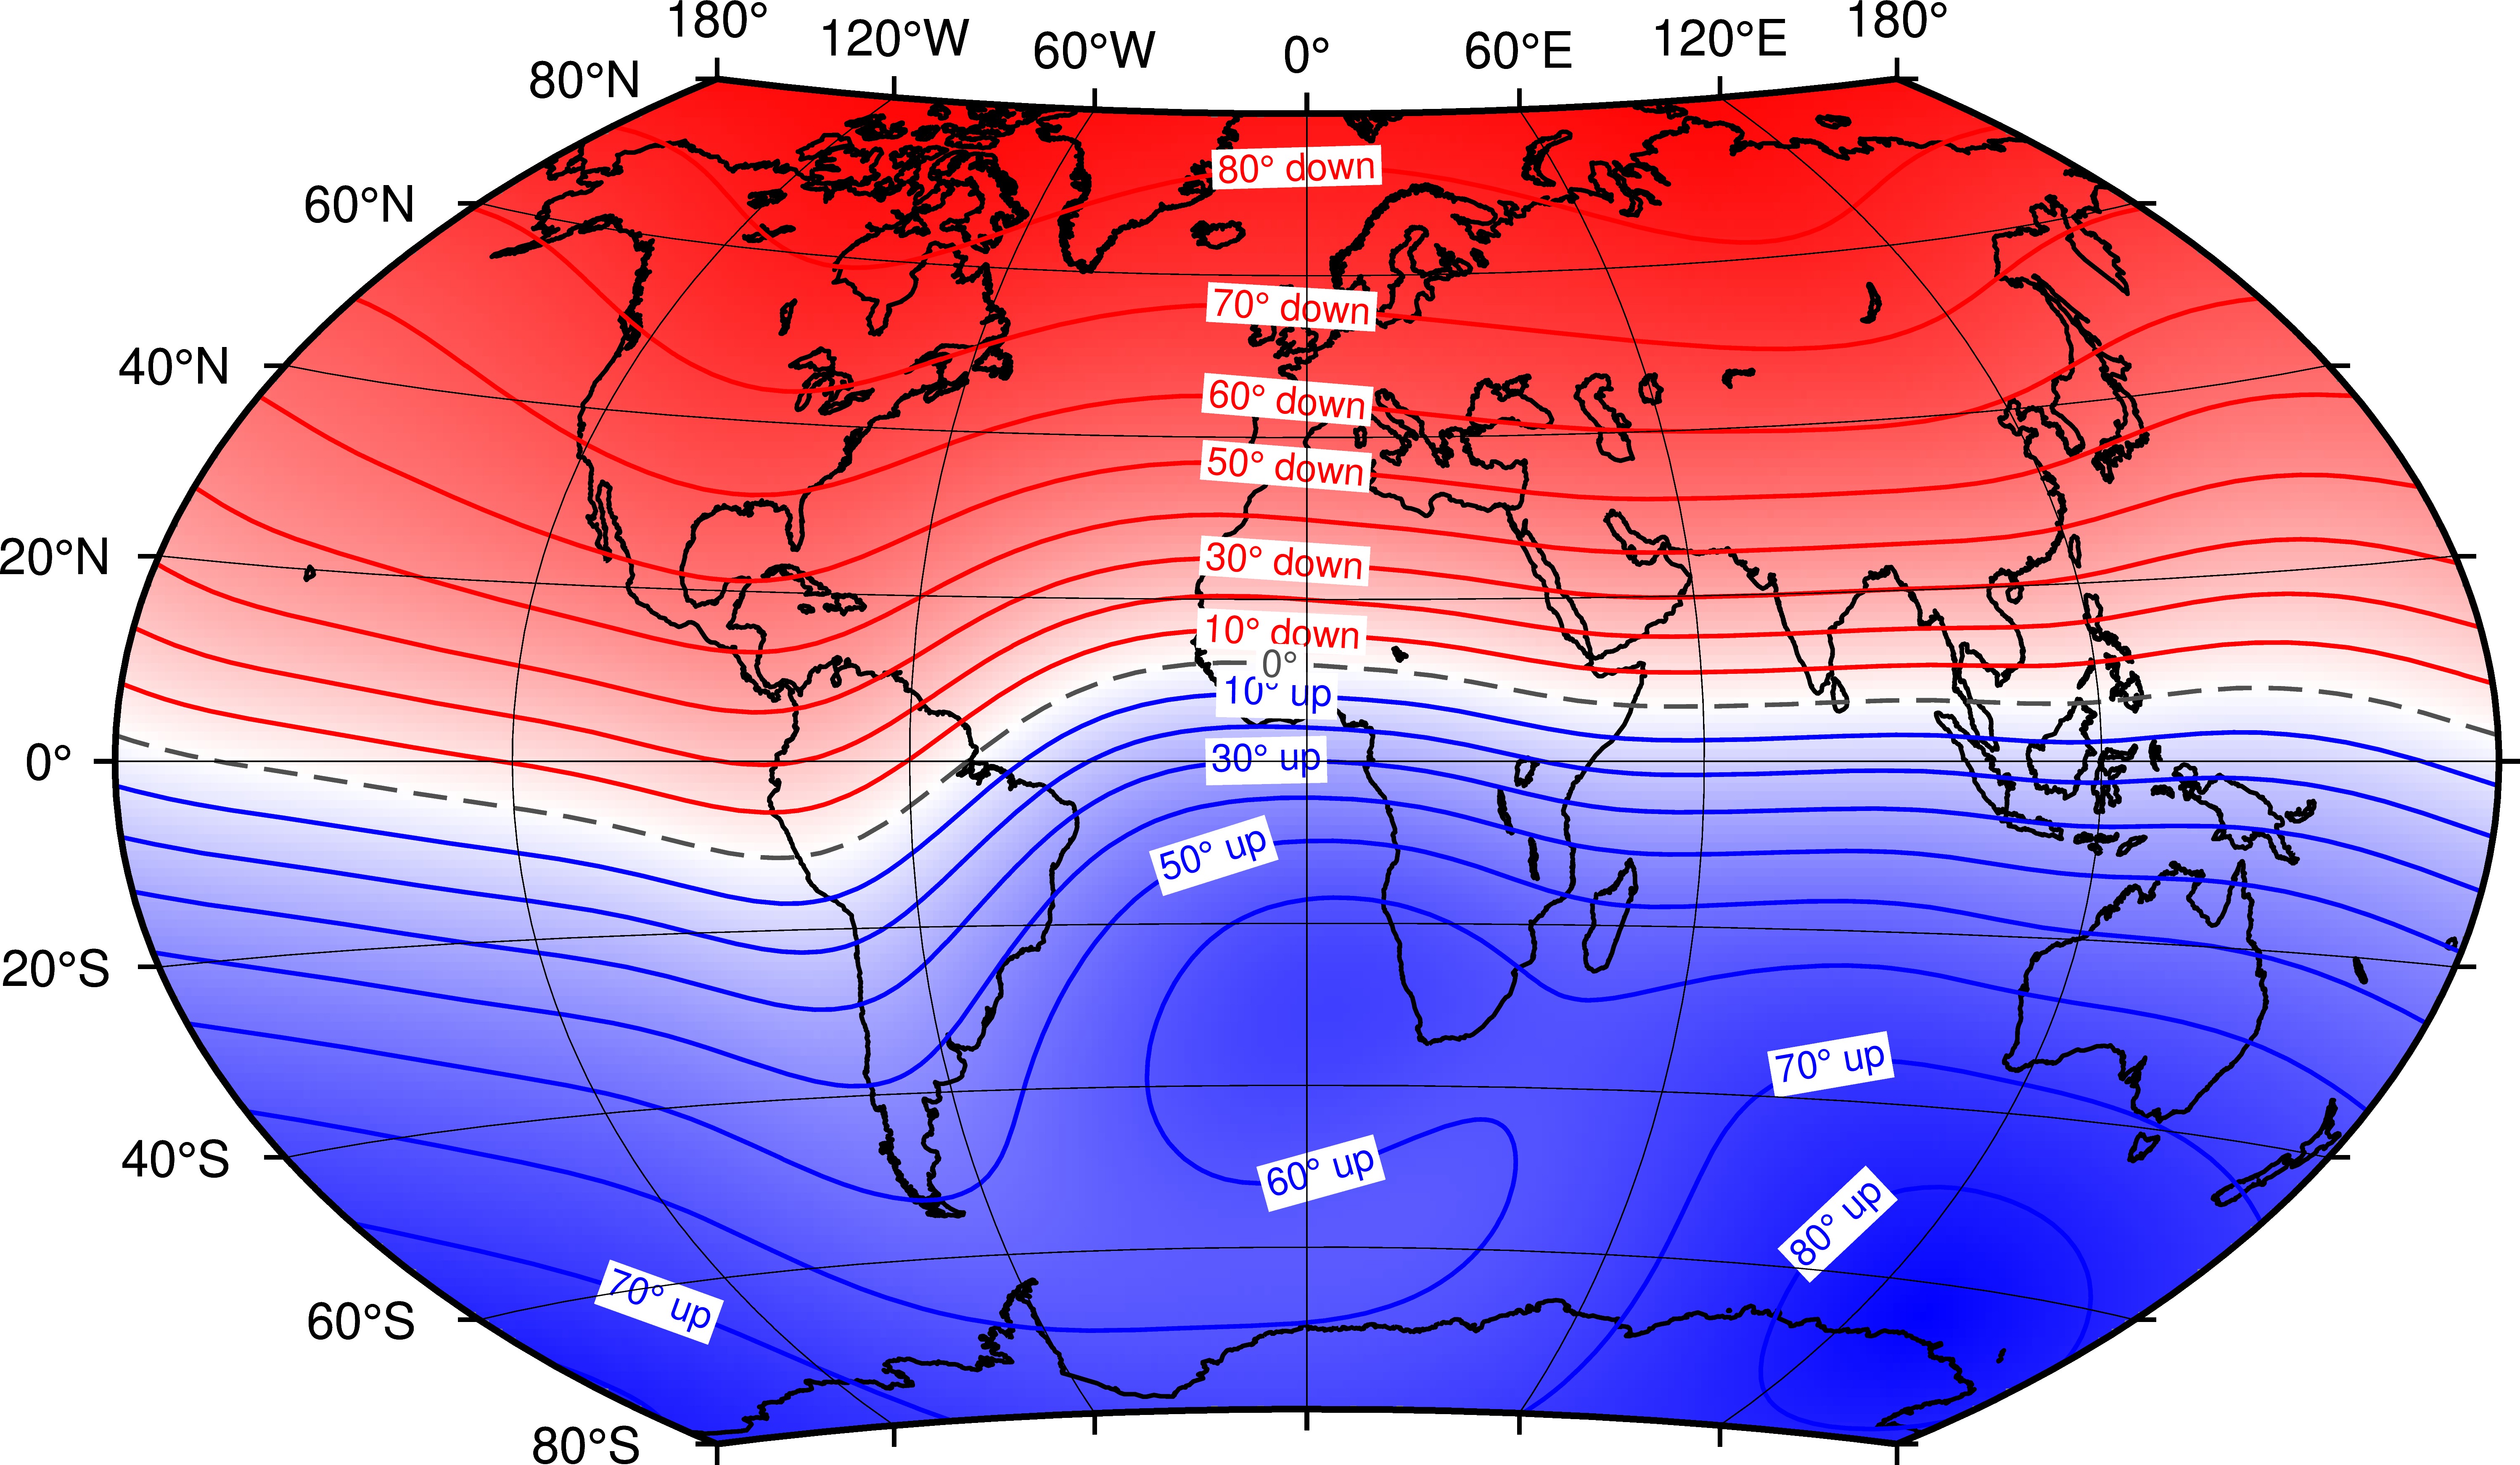
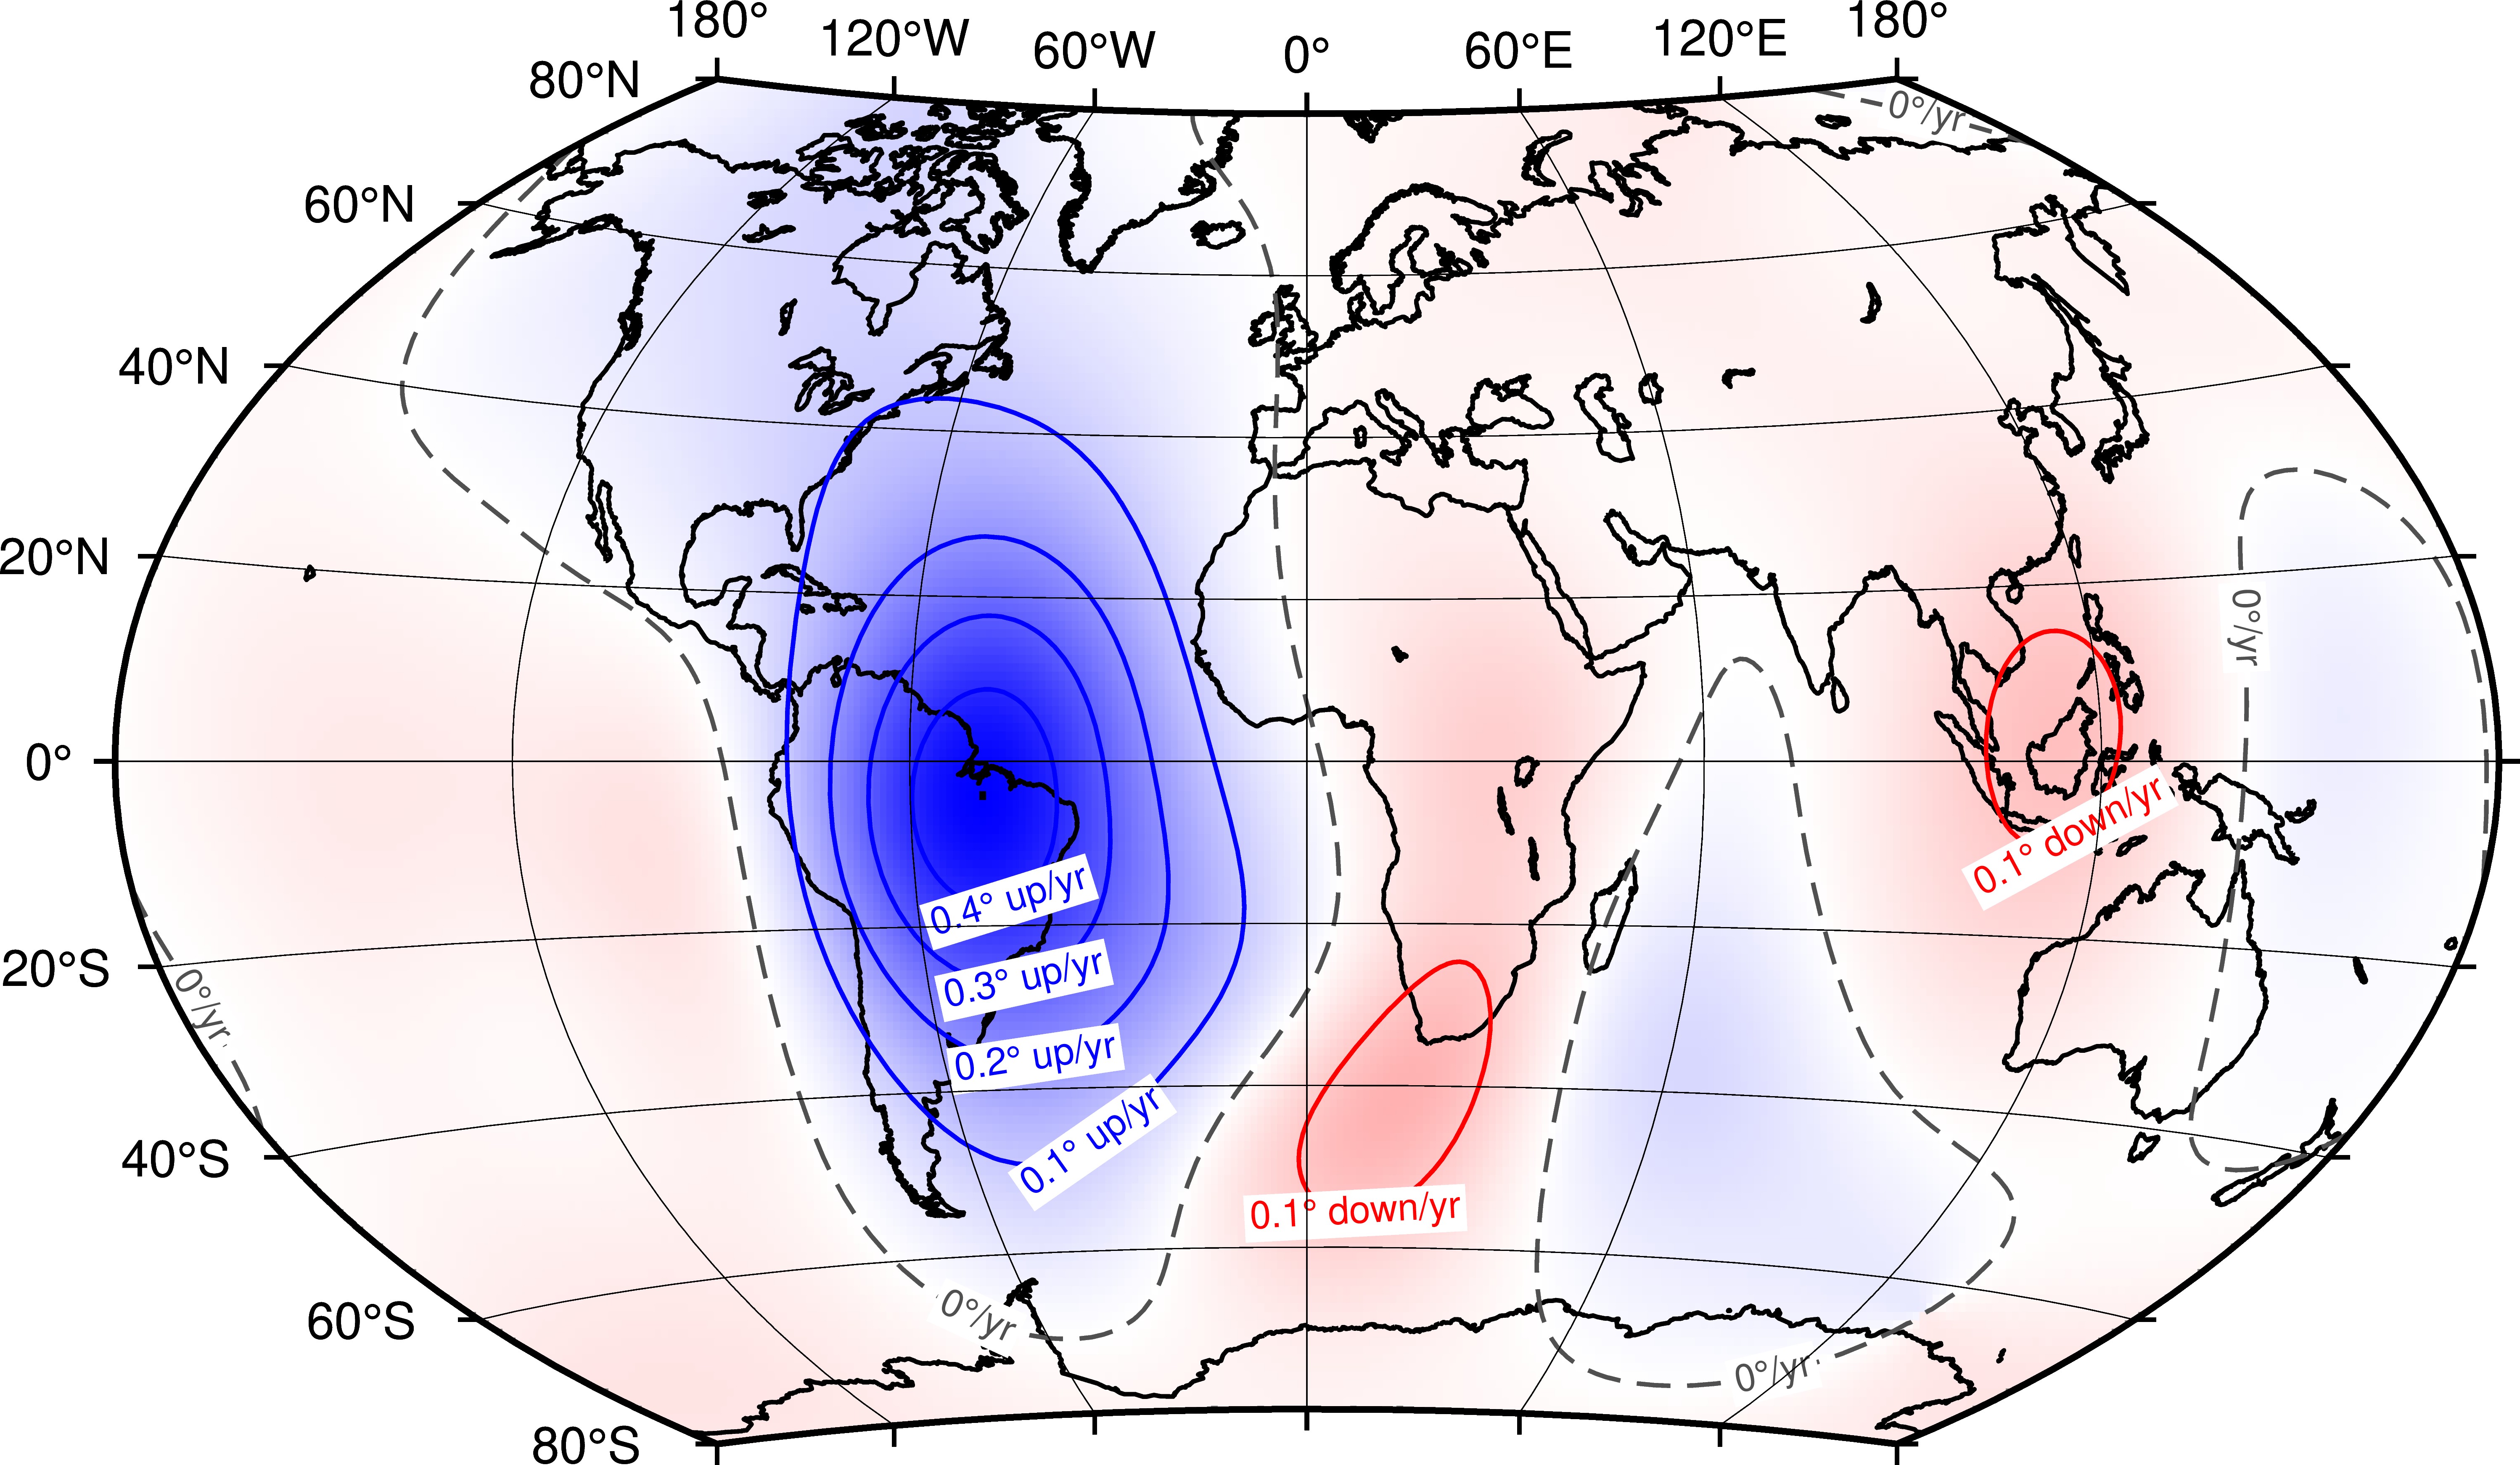
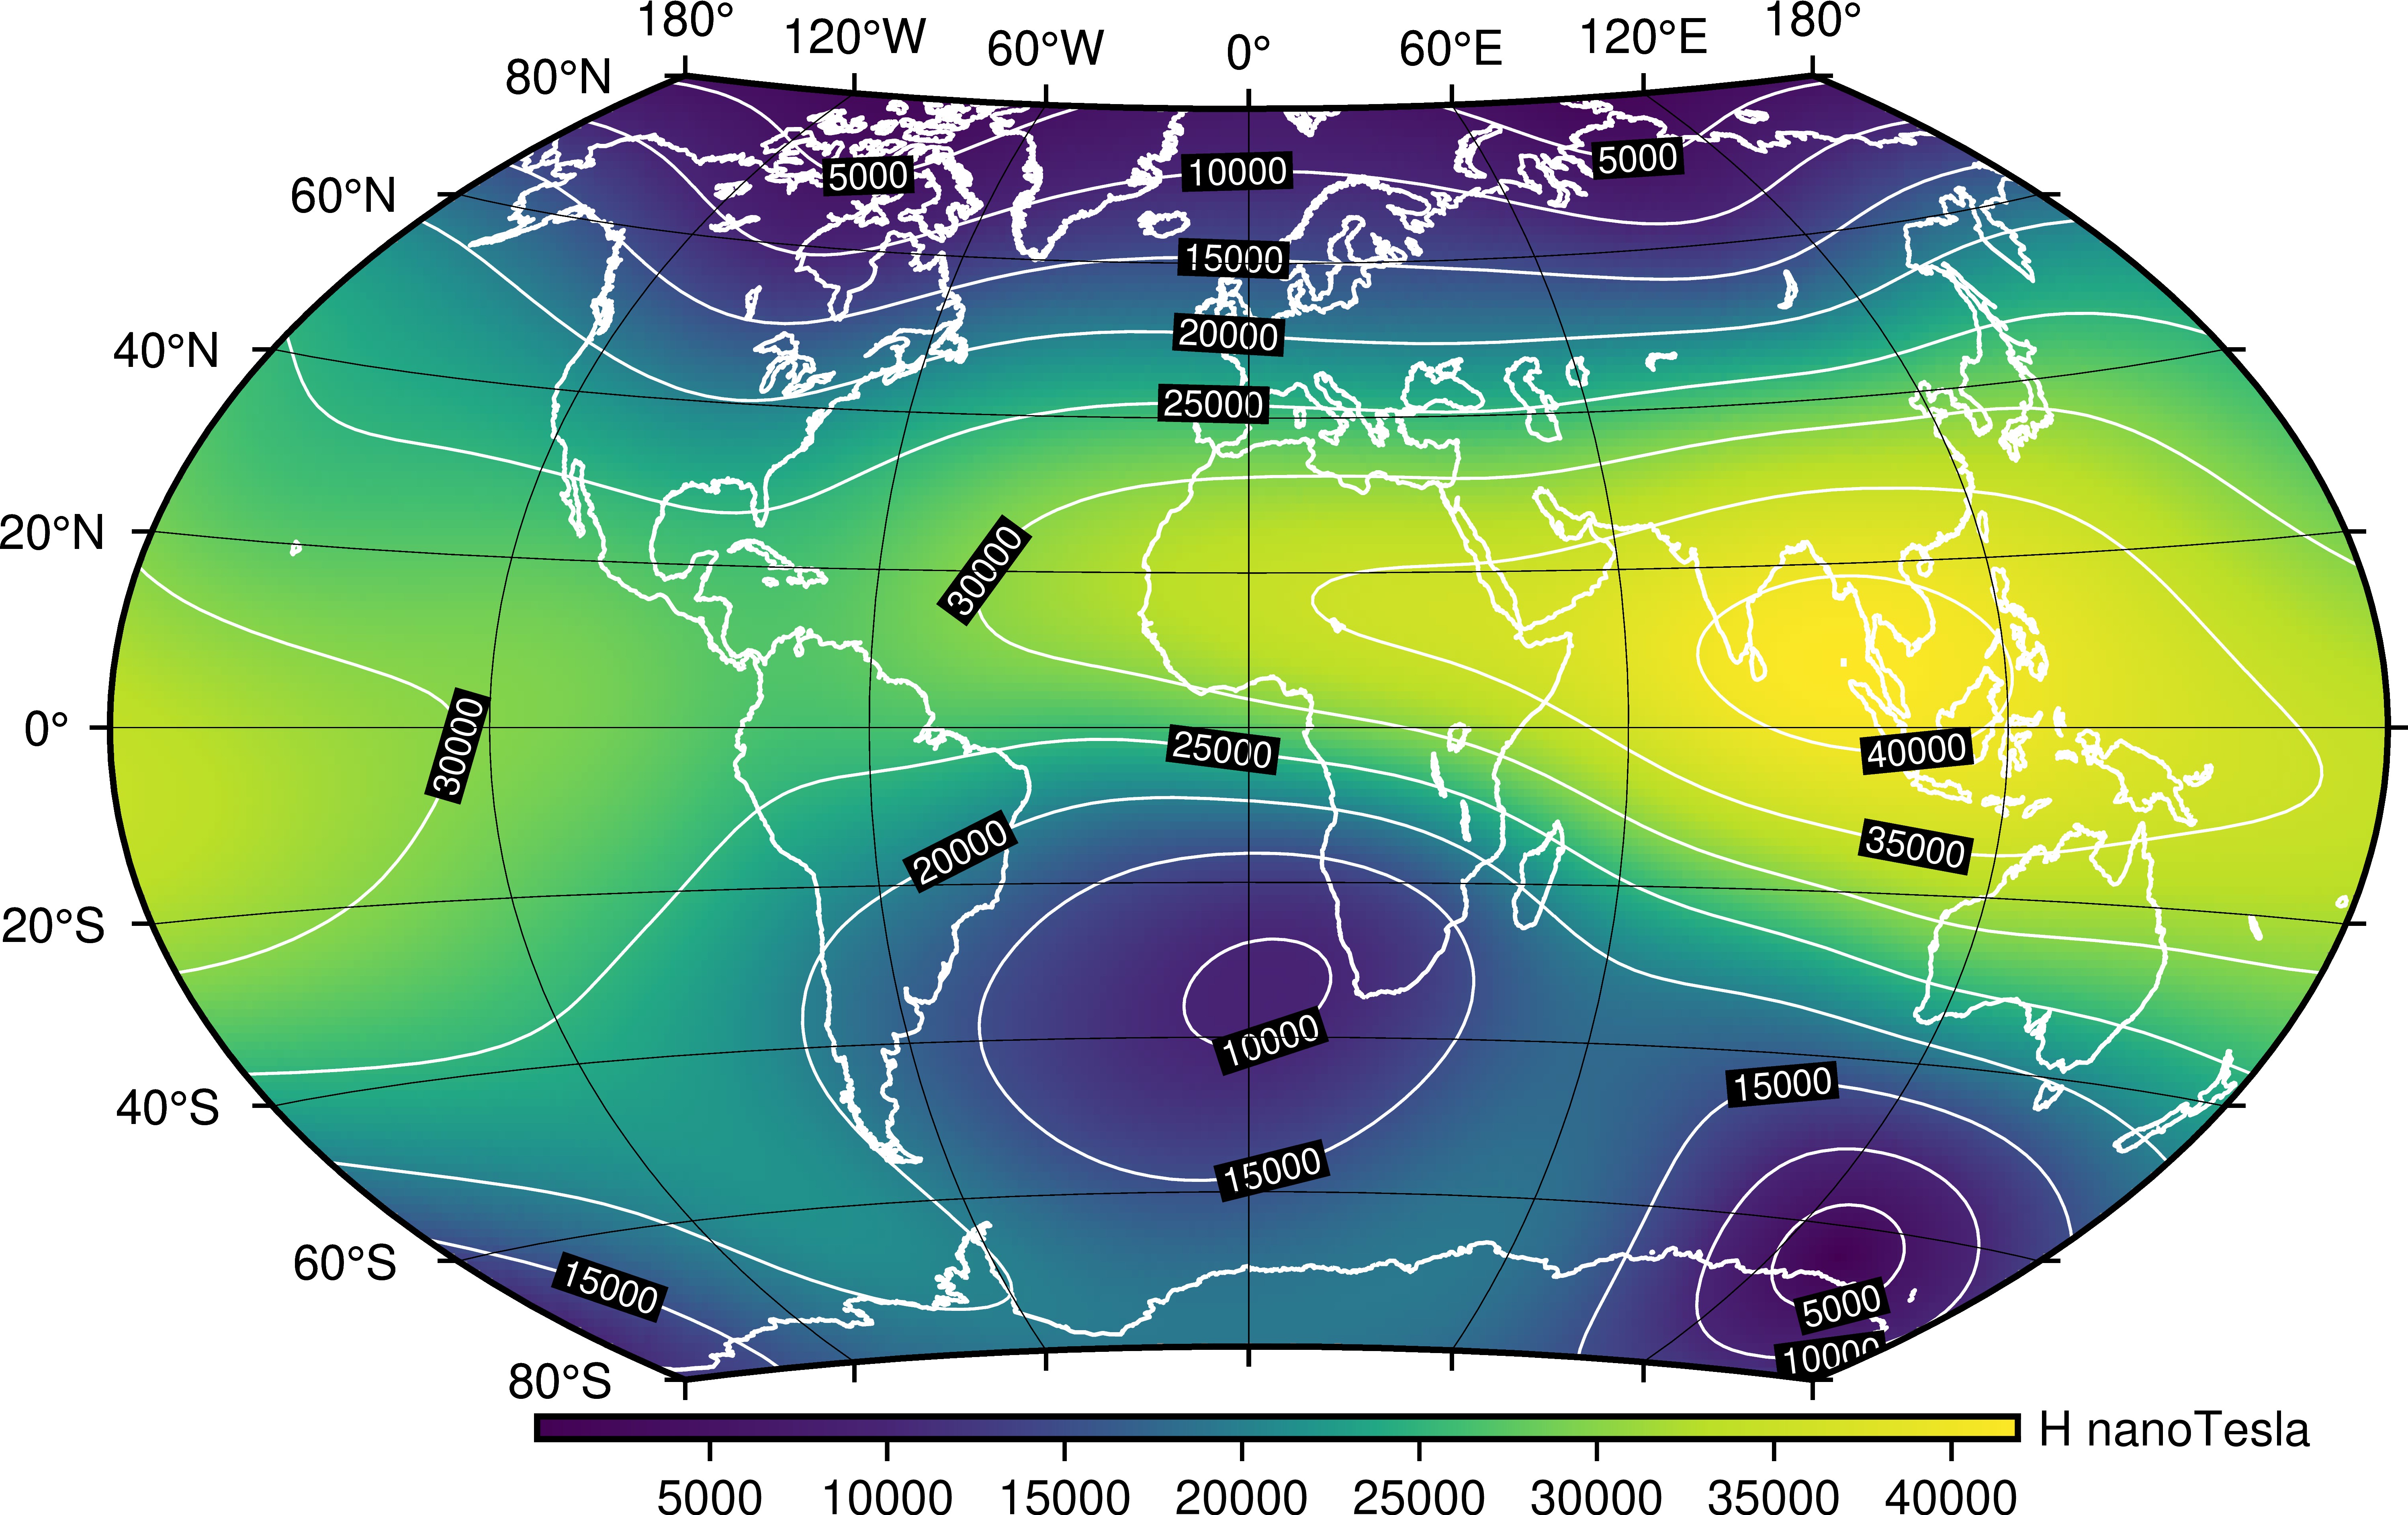
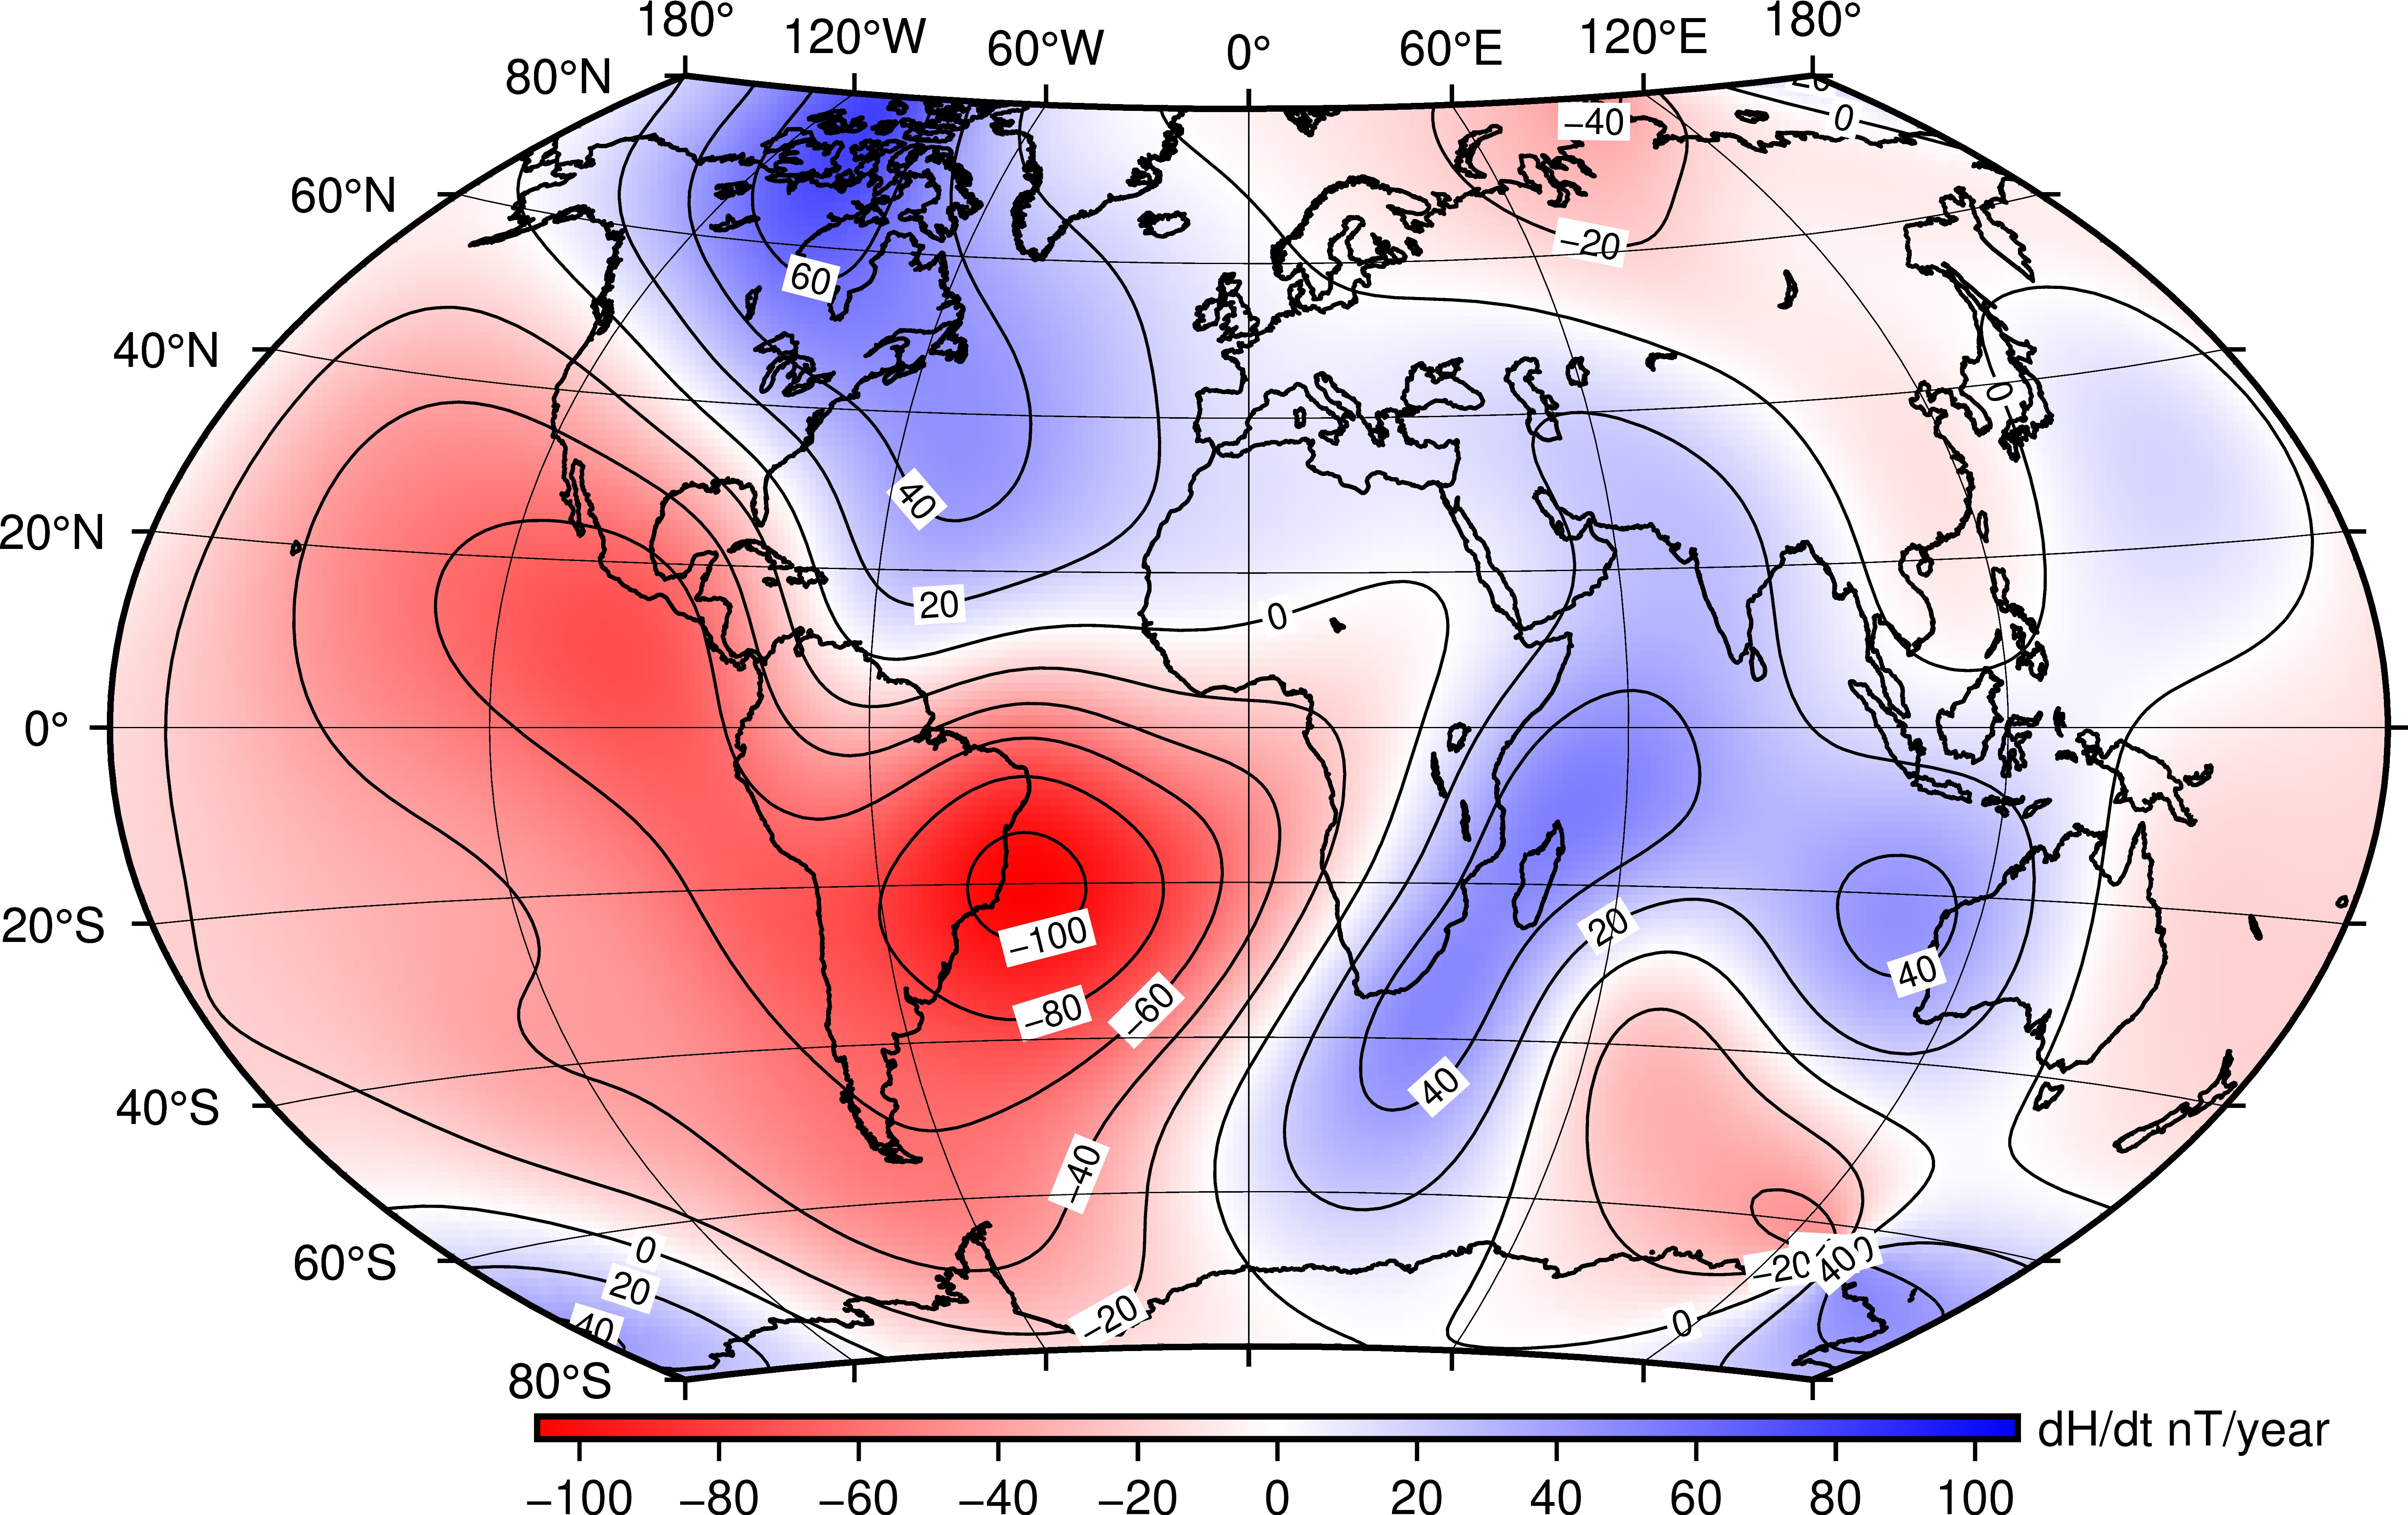
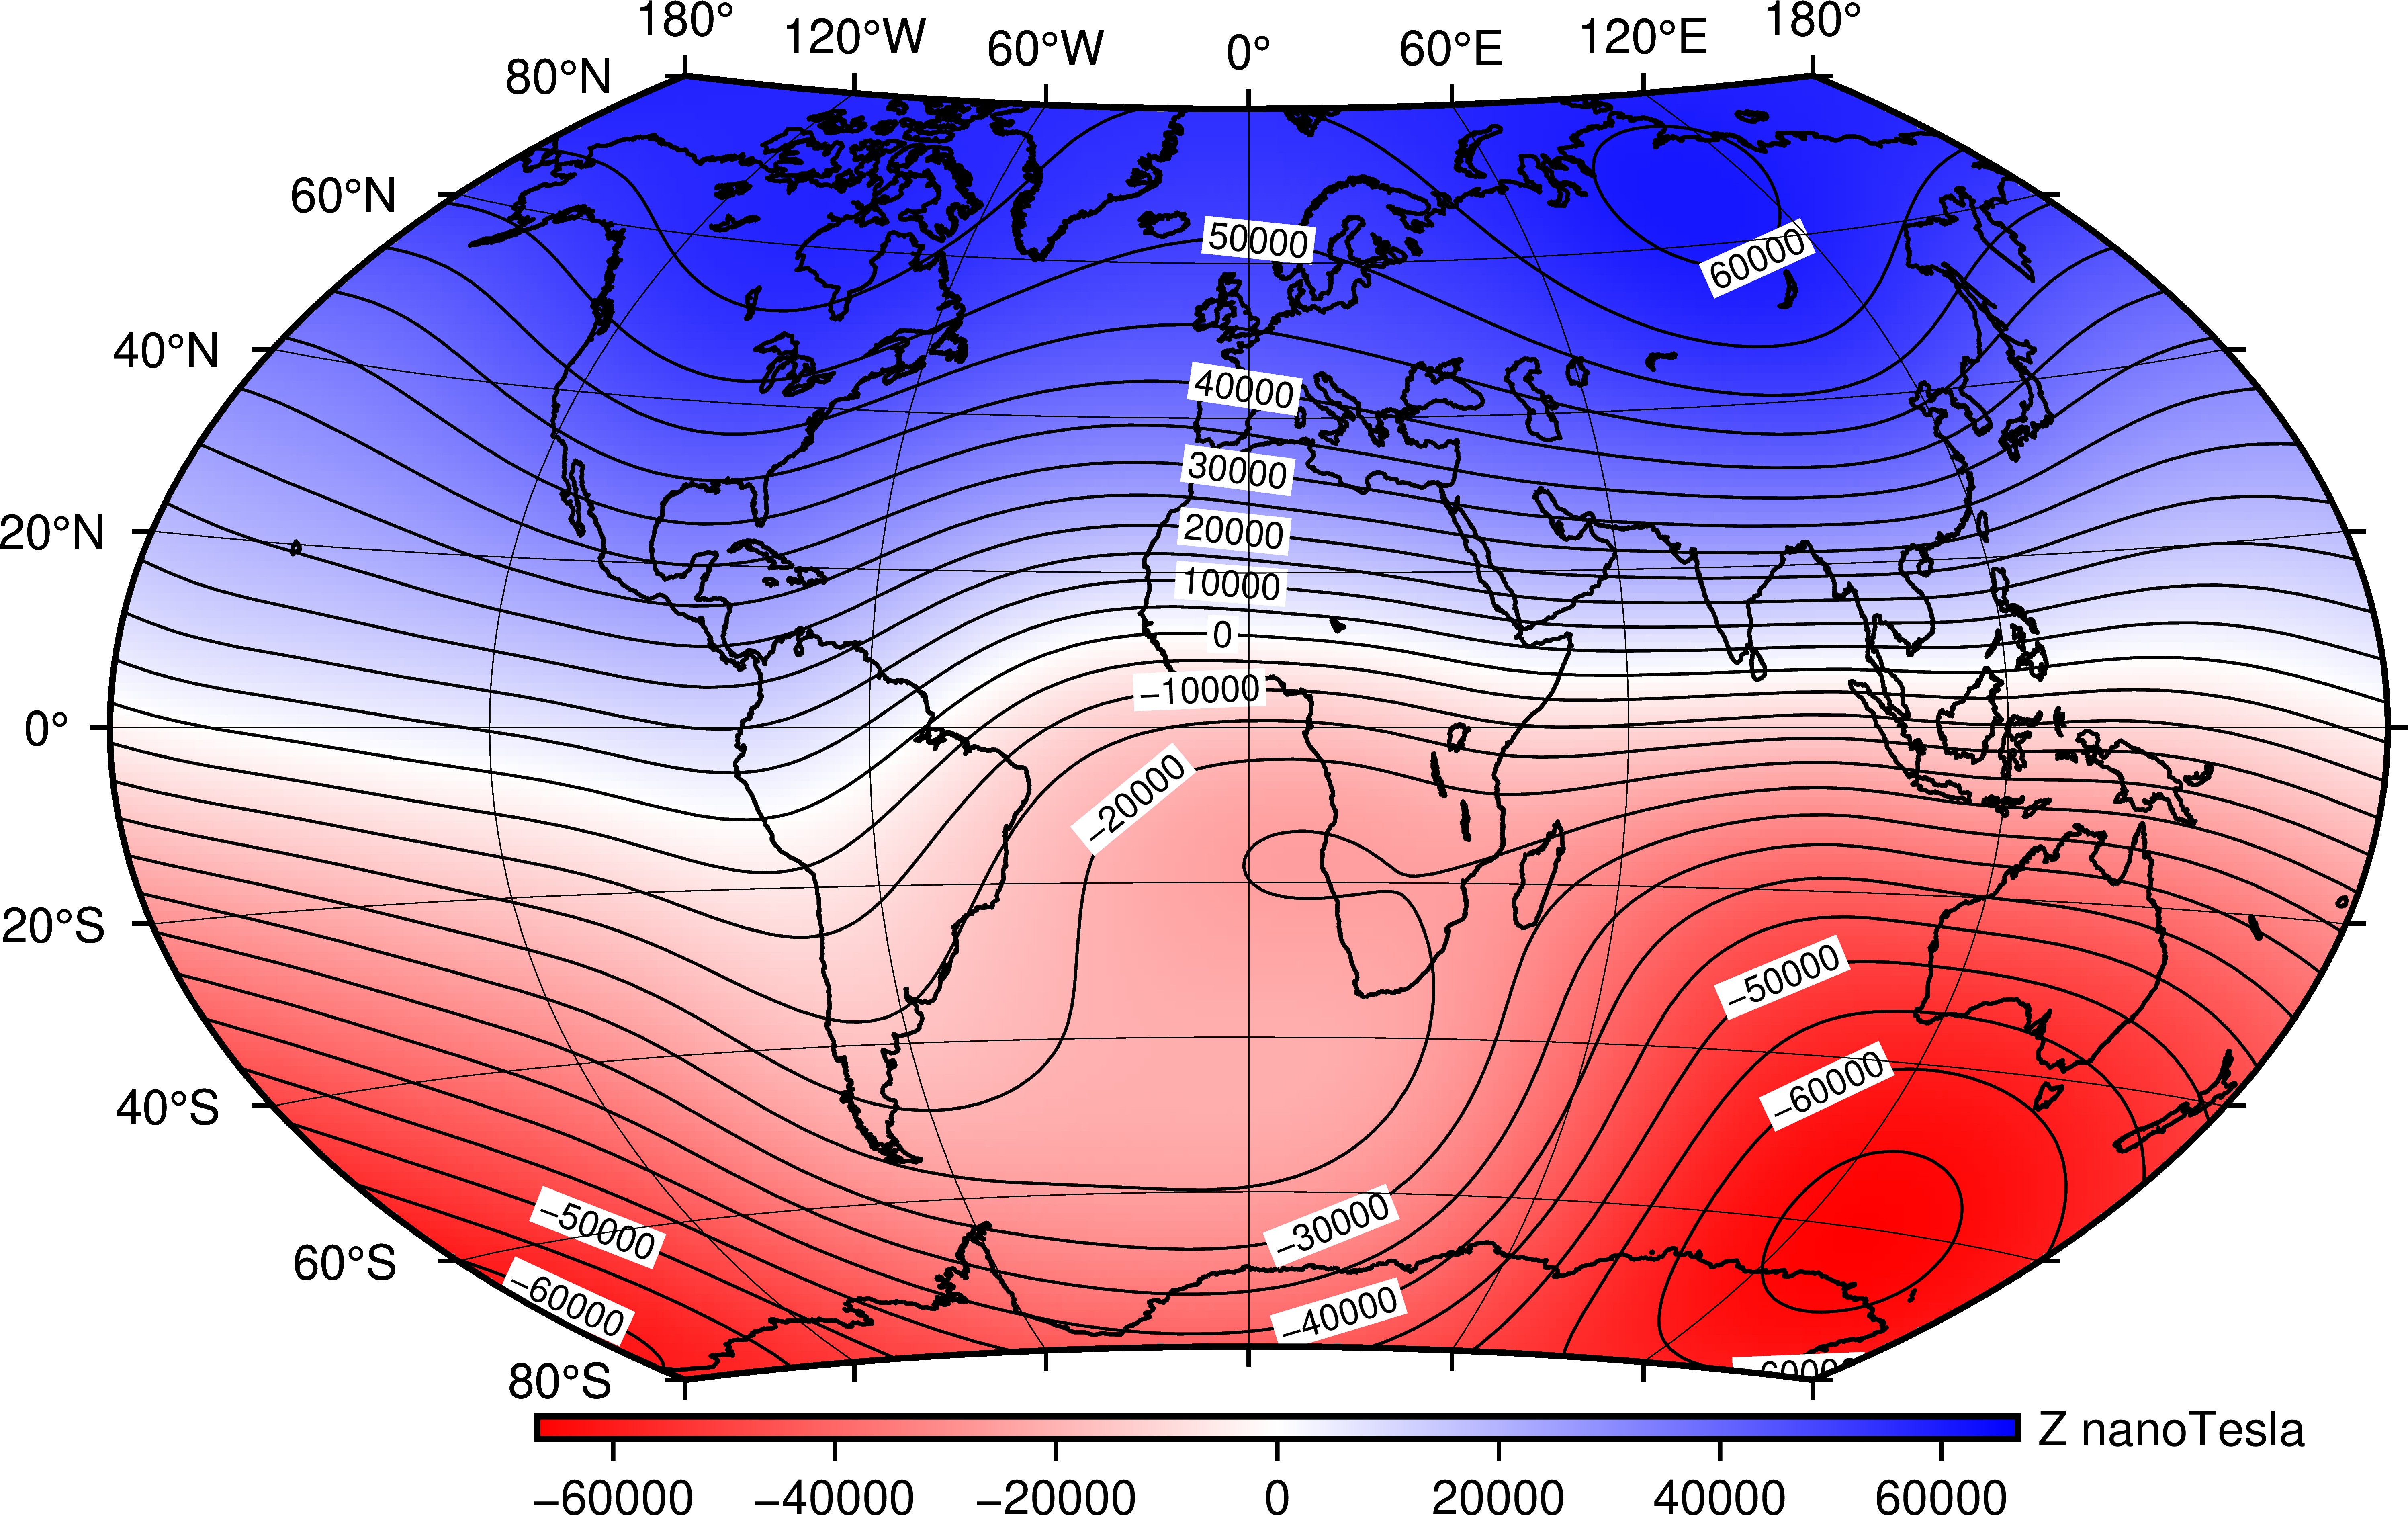
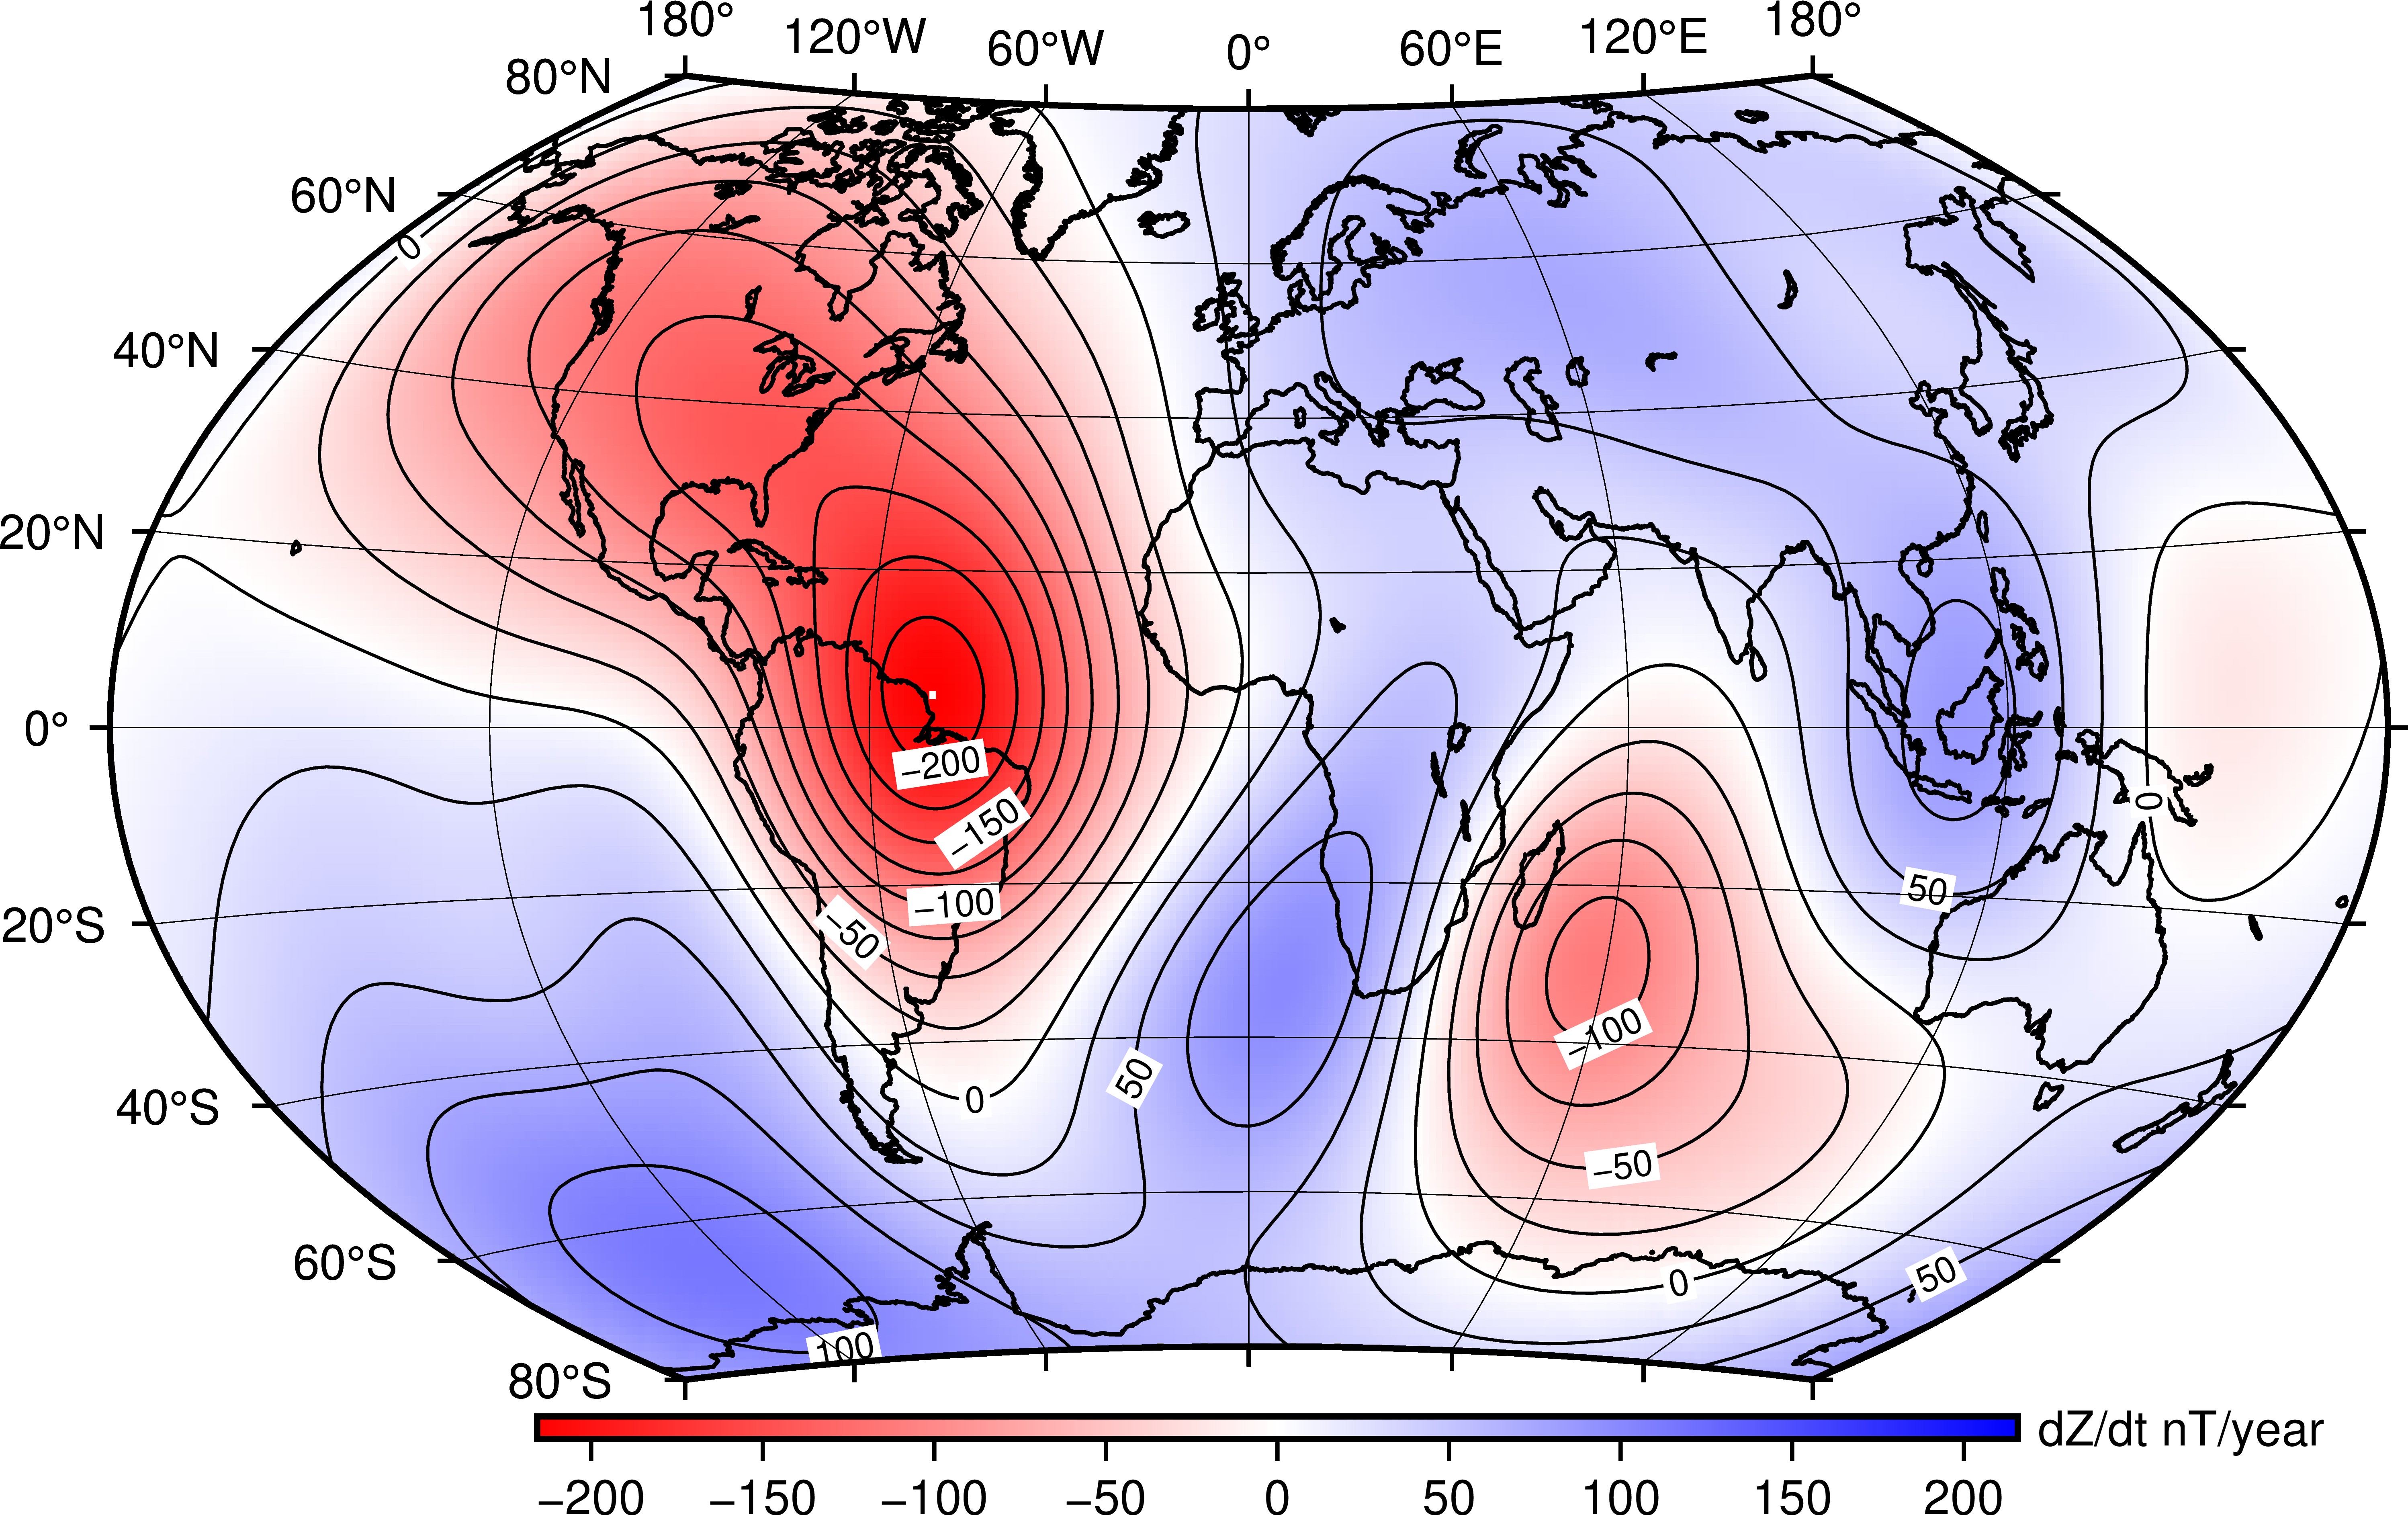
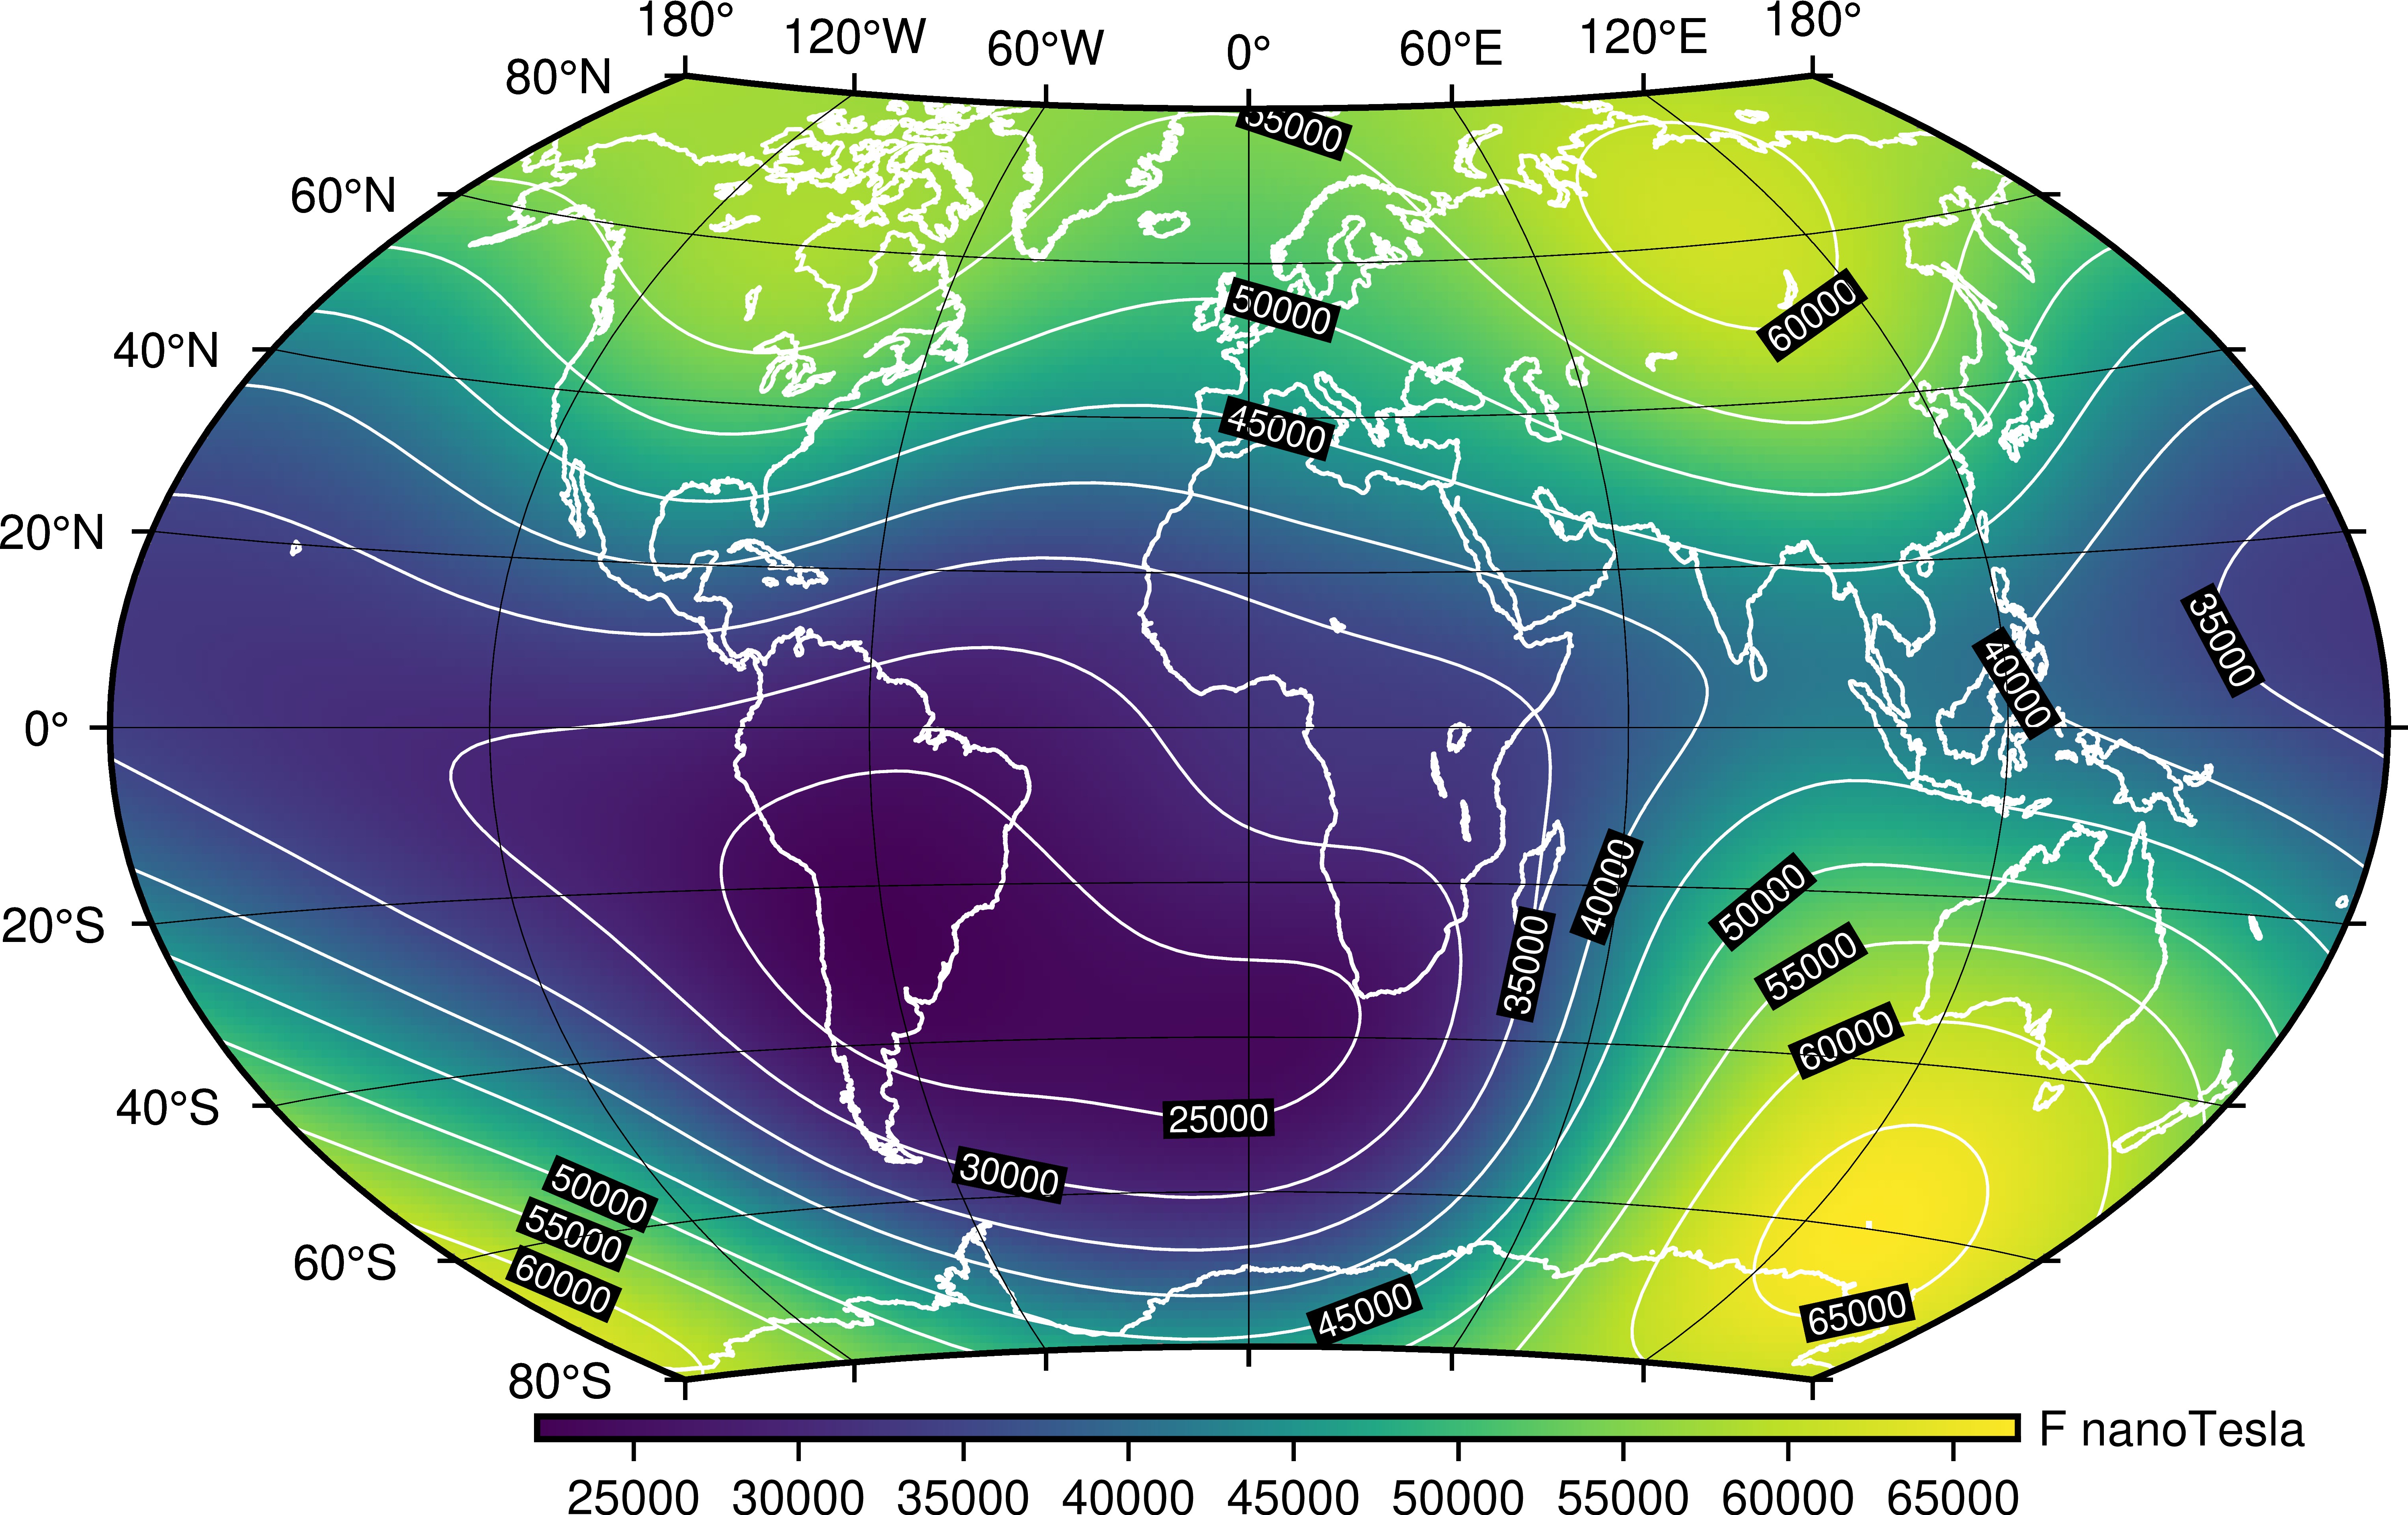
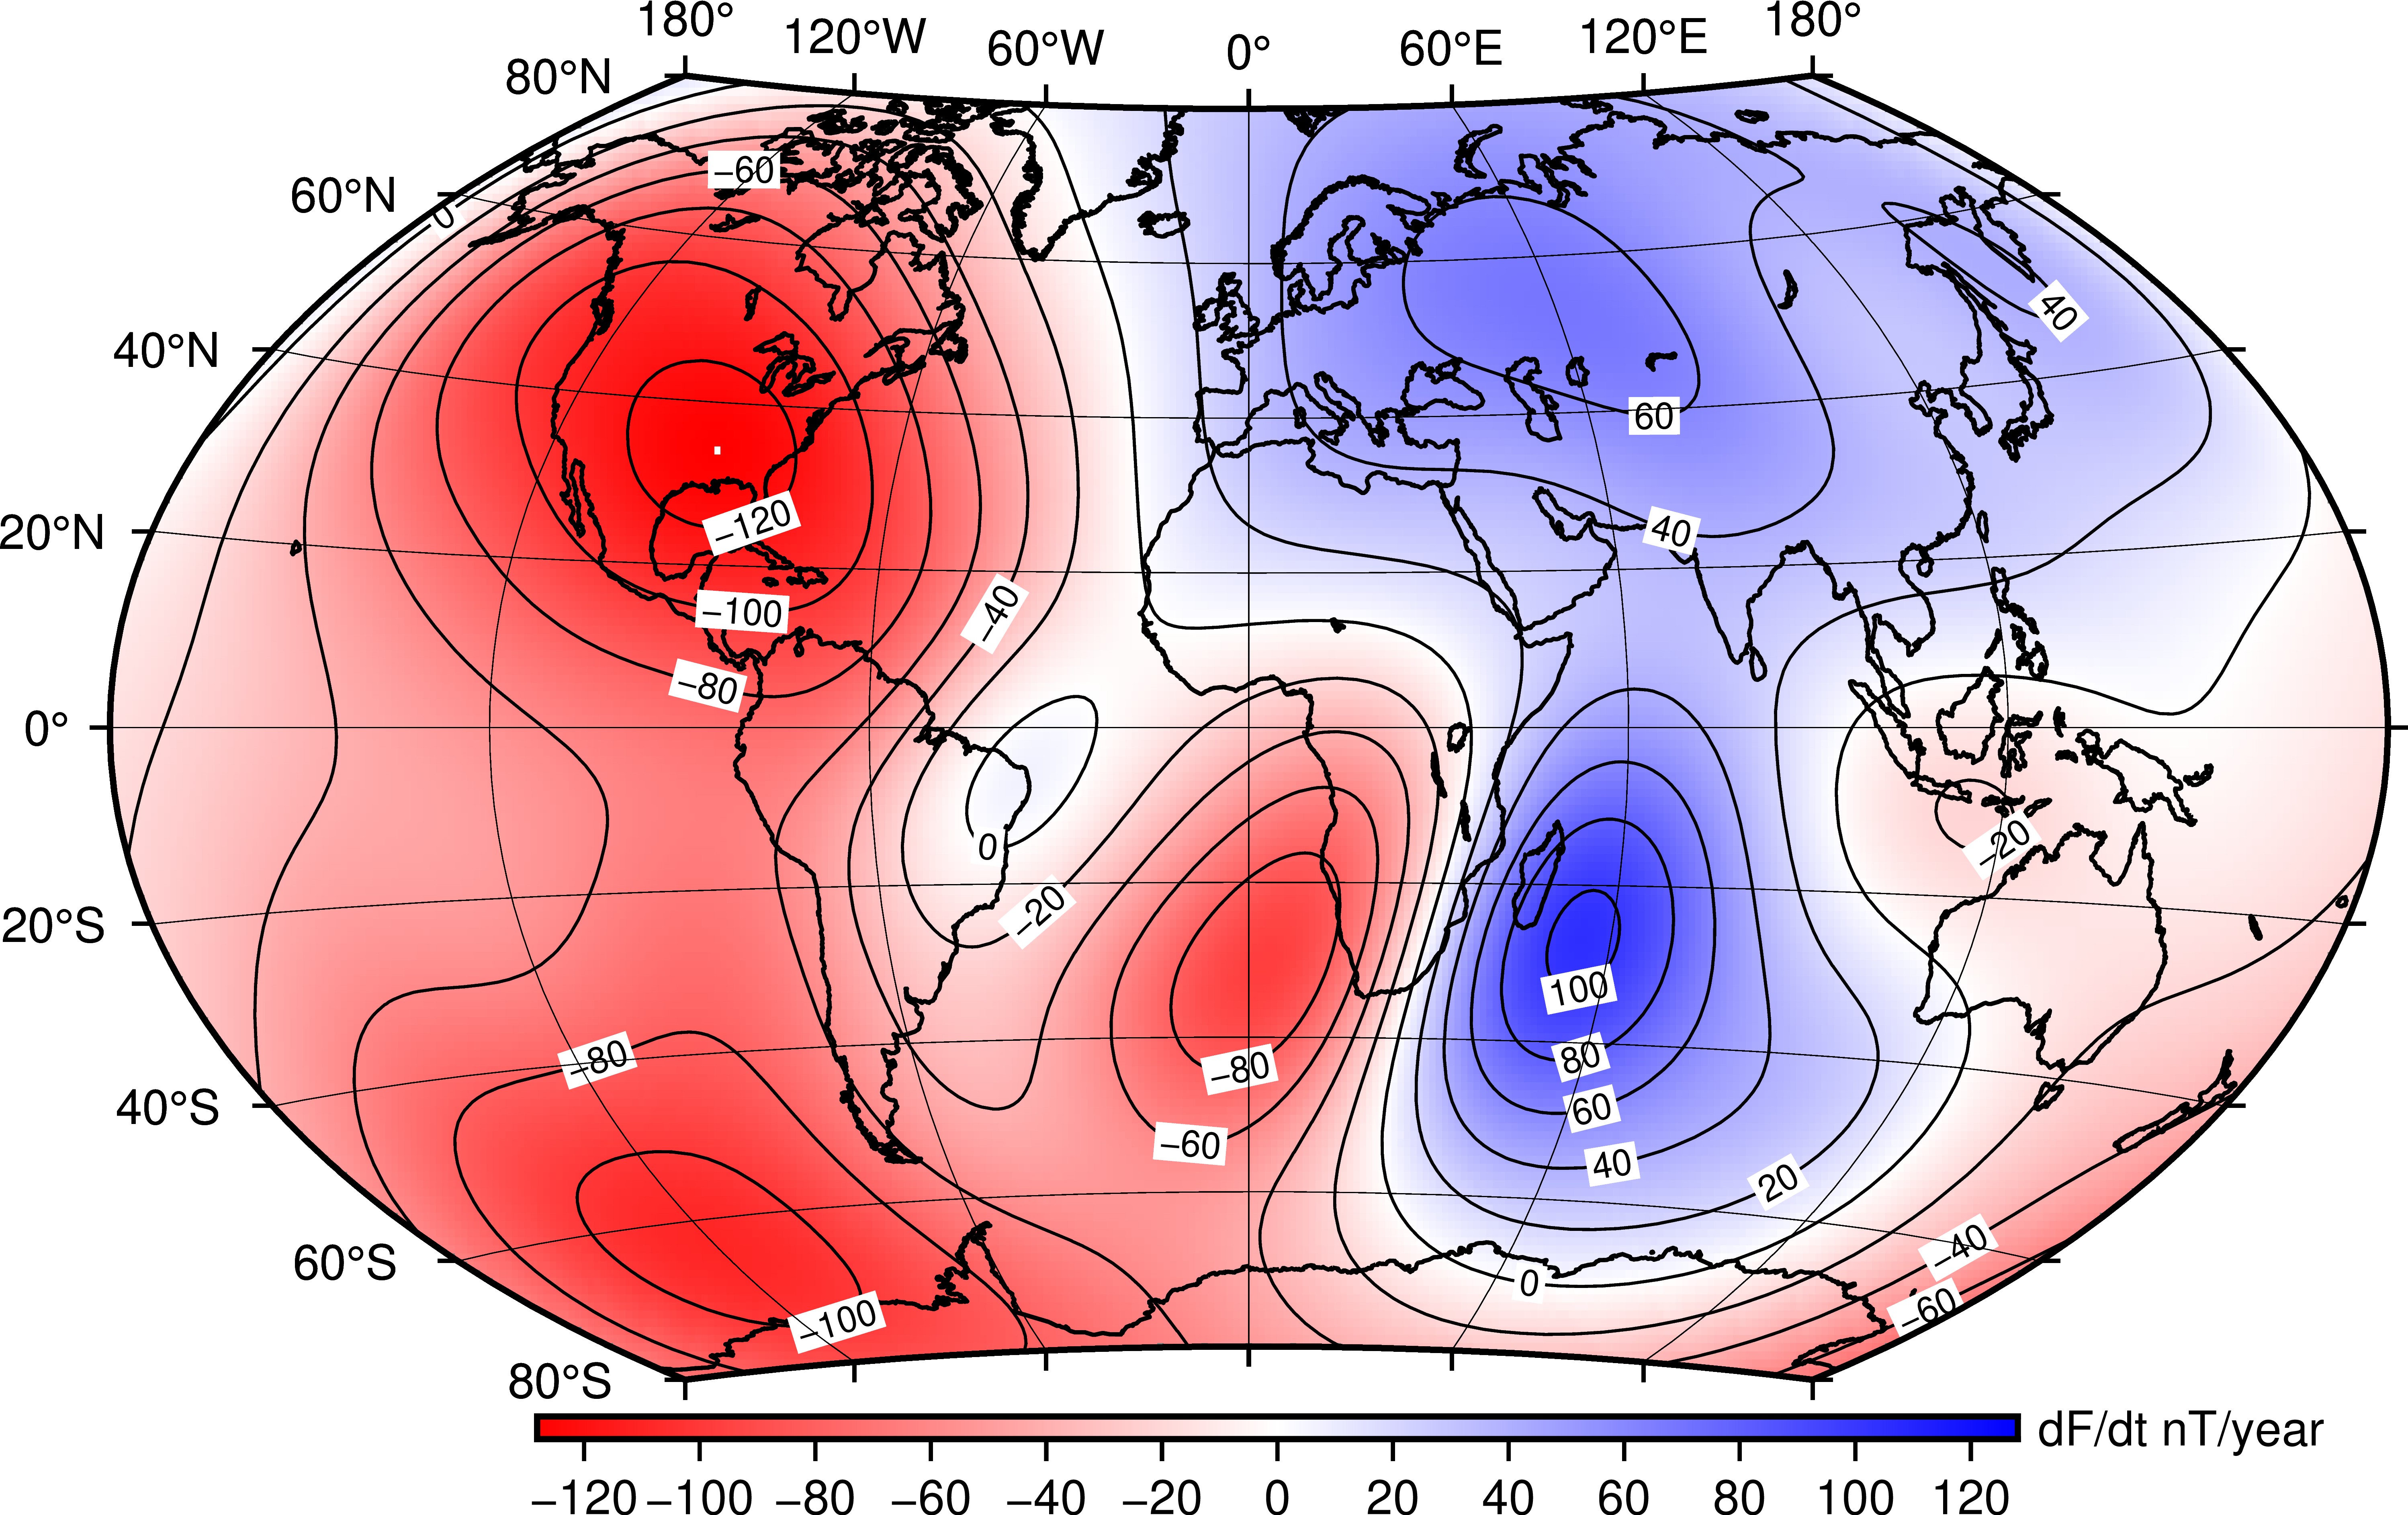
As well as describing maps of field components, as shown below, models such as the IGRF also provide information about the locations of the magnetic poles and a basis for geomagnetic coordinate systems.
Uncertainties
The IGRF aims to provide a model of the main field which is accessible to a variety of users. It is meant to give a reasonable approximation, at, near and above the Earth's surface, to that part of the Earth's magnetic field which has its origin inside the surface. However, it clearly cannot capture all internal sources due to small-scale features of the crustal field and will also not capture the non-linear features of secular variation. The estimates of uncertainty were made by comparing the IGRF-13 model values to repeat station and observatory measurements. The global differences (or residuals) are used to compute the mean (which is about zero) and the standard deviation for each magnetic field component. The absolute values of the residuals are then sorted to compute the confidence intervals (CI) i.e. the value at which the proportion of the data is less than a chosen percentage.In terms of a single nominal, or average, global uncertainty associated with the IGRF models between 1980 and 2020, the standard deviation of the residuals in North (X) component is 144 nT, 136 nT in the East (Y) component and 293 nT in vertical (Z) component. For declination it is 0.39°, in inclination it is 0.29°, and for total field intensity it is 178 nT. More carefully, as the distribution of the residuals is Laplacian, the uncertainties of X, Y and Z can be estimated to be 87, 73 and 114 nT at 68.3% confidence interval. This can be interpreted as meaning that for 68.3% of the measurements you make (on average across the globe), the IGRF is within the estimated uncertainty. Obviously, if you are in a highly anomalous area (like a volcanic island) the uncertainties will be larger. Equally, if you are in a low anomaly region (such as a sedimentary basin) the uncertainties will likely be smaller. The table below shows the uncertainty in each component. See Beggan (2022) for further detail.
| Component | Standard Deviation | 68.3% CI | 95.4% CI | 99.7% CI |
|---|---|---|---|---|
| D (°) | 0.39 | 0.18 | 0.95 | 2.06 |
| I (°) | 0.29 | 0.12 | 0.52 | 2.29 |
| H (nT) | 135 | 82 | 341 | 610 |
| X (nT) | 144 | 87 | 344 | 526 |
| Y (nT) | 136 | 73 | 322 | 575 |
| Z (nT) | 293 | 114 | 481 | 2236 |
| F (nT) | 178 | 103 | 432 | 839 |
- Global Geomagnetic Models
- Space Weather and Geomagnetic Hazard
- High-frequency magnetometers
- Schumann Resonances
- Geoelectric field monitoring
- Space Weather Impact on Ground-based Systems (SWIGS)
- SWIMMR Activities in Ground Effects (SAGE)
- Geomagnetic Virtual Observatories
- Quantum magnetometers for space weather
- Magnetotellurics
- Publications List
- Evidence-based uncertainty estimates for the International Geomagnetic Reference Field, Beggan (2022)
- International Geomagnetic Reference Field: the 13th generation, Alken et al. (2021)
- The BGS candidate models for IGRF-13 with a retrospective analysis of IGRF-12 secular variation forecasts, Brown et al. (2021)
- Evaluation of candidate models for the 13th generation International Geomagnetic Reference Field, Alken et al. (2021)
